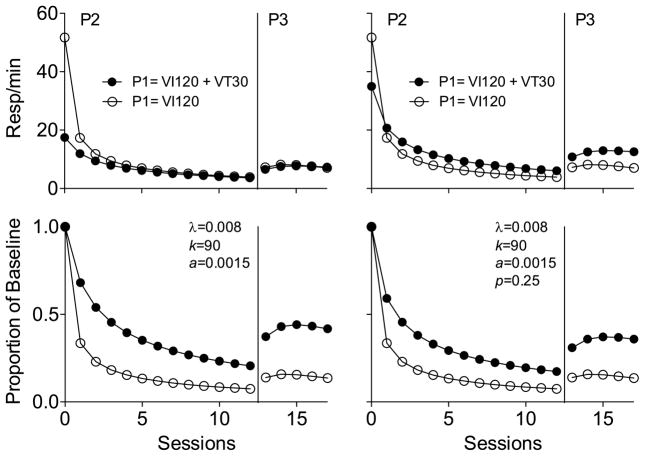
Fig. 21.
The top panels shows simulations of absolute rates of target responding in Phases 2 and 3 following Phase 1 reinforcement in a multiple schedule with equal rates of contingent reinforcement in both components and added non-contingent reinforcement in one component. The bottom panels are expressed in terms of proportion of Phase-1 (baseline) rates. Parameter values are the same as in Fig. 20 with the addition of the p parameter in the simulations in the right-hand panels. See text for details.

