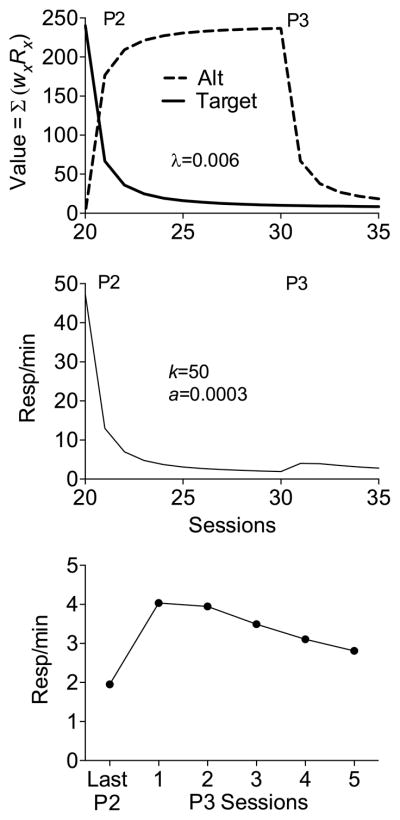
Fig. 7.
The top panel shows value functions generated by the sTWR (Eq. (9)) using a currency term (i.e., c) determined by reinforcement rates according to Eq. (10) with λ = 0.006. Phase 1 target = VI15, Phase 2 alternative = VI15. The middle panel shows absolute response rates based on this value functions generated by Eq. (11). The bottom panel provides a zoomed view of the last day of Phase 2 and five Phase 3 resurgence sessions.

