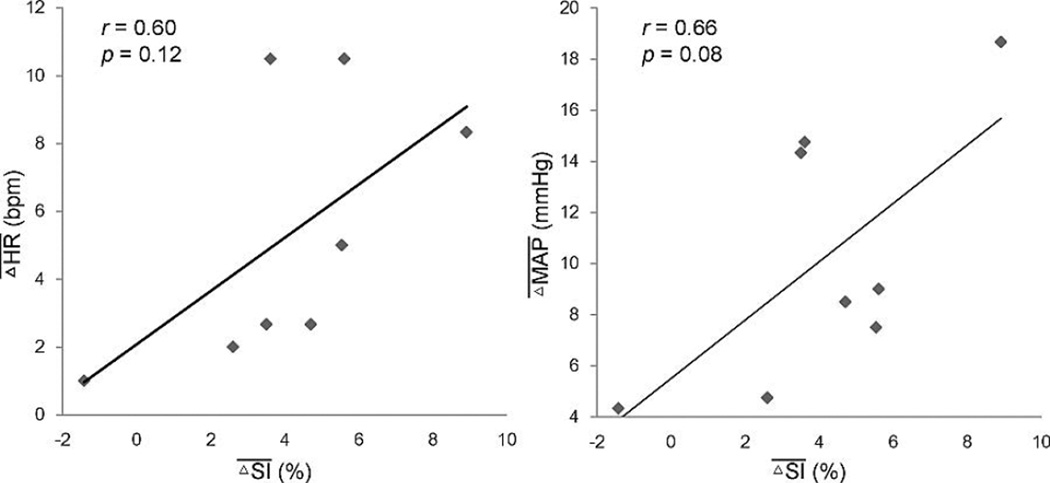
Figure 5.
Relationship between T2*-weighted signal change and heart rate and blood pressure change during the phase of positive T2*-weighted signal change in PAD. The value of and from each PAD patient were obtained by averaging the corresponding measurements over the time period with positive T2*-weighted signal.

