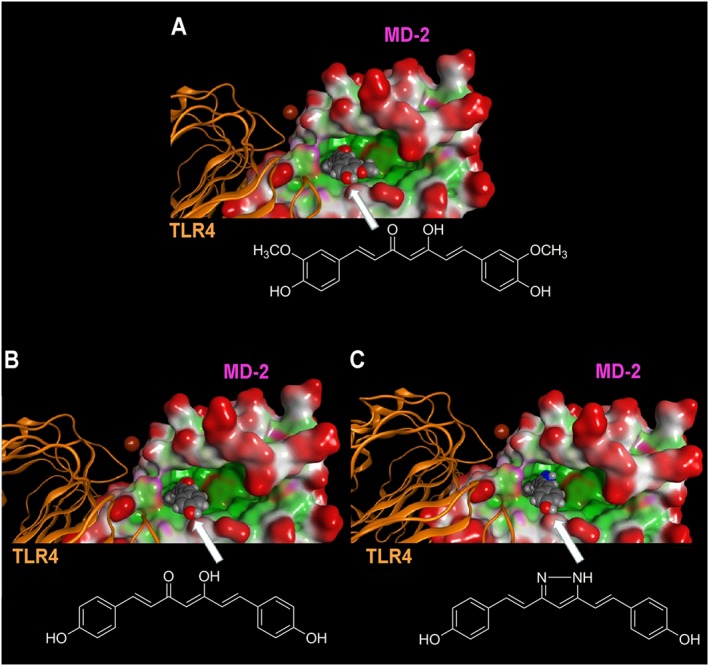
Figure 5.

Molecular docking analysis of the energetically most stable binding poses between (A) curcumin, (B) GG6, (C) GG9 and MD‐2. As described in Figure 4, the LPS binding cavity of MD‐2 is enlarged and shown as the Connolly surface. Hydrophobic regions of the Connolly surface are green, polar in magenta and those exposed to solvent in red. Mg2+ is represented by CPK (bronze).
