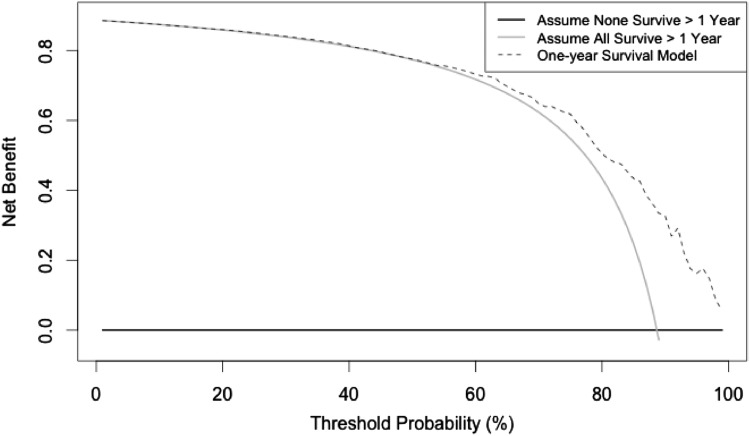
Fig. 2.
Net benefit is plotted on this decision curve analysis graph against threshold probabilities and shows the benefit of intervention based on decision to treat from a model output. Threshold probability (pt), is the probability of survival at which the surgeon would recommend treatment. Net benefit = ([true positive count/n] − [false positive count/n]) × (pt / 1 − pt).

