Figure 6.

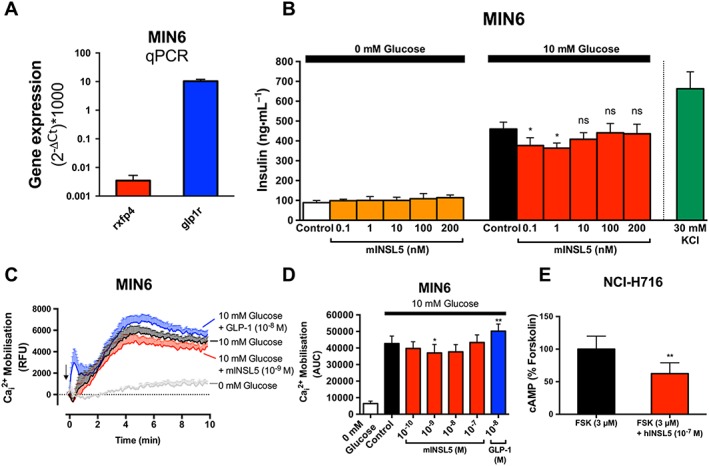
INSL5 inhibits glucose‐stimulated insulin secretion and calcium mobilisation in MIN6 murine insulinoma cells and cAMP accumulation in NCI‐H716 human enteroendocrine (NHI‐H716) cells. In (A), real‐time quantitative PCR (qPCR) assay to determine the expression levels of rxfp4 and glp1r that are expressed as ratios relative to actb, multiplied by 1000 (n = 6). In (B), MIN6 cells equilibrated for 2 h in KRB buffer, followed by stimulation in either 0 or 10 mM glucose by mINSL5 (0.1–200 nM) for 2 h. Supernatants were assayed for insulin (expressed in ng•mL−1; n = 5). In (C), Ca2 + mobilisation in MIN6 cells (n = 5) using Fluo‐4‐AM (1 μM) in response to 10 mM glucose alone or in the presence of mINSL5 (10−9 M) or GLP‐1 (10−8 M). Concentration–response relationships for inhibition of Ca2 + responses (AUC) by INSL5 were bell shaped (D). In (E), NCI‐H716 human enteroendocrine cells stimulated with forskolin (3 μM) showed inhibition of cAMP accumulation with hINSL5 (10−7 M; n = 5). Data points represent mean ± SEM of n independent experiments. *P < 0.05; significantly different from control. RFU, Relative Fluorescence Unit ns, non‐significant.
