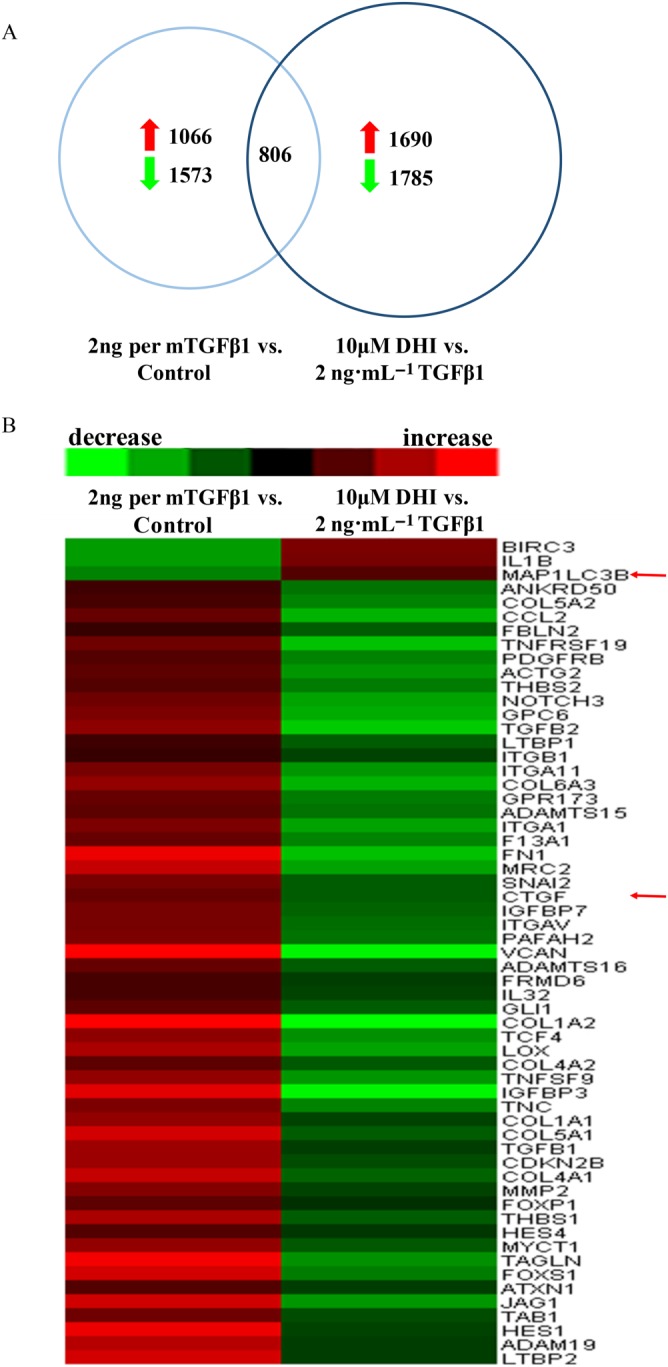
Figure 4.

Microarray analysis of LX‐2 cells. Total RNA was isolated from five independent LX‐2 cell samples, and then each group of total RNA was mixed with the same amount of total RNA from each group then labelled with Cy3/Cy5 and measured by microarray assay. Red: increase in gene expression; green: decrease in gene expression in LX‐2 cells. (A) Number of genes significantly altered in microarray assays. (B) Expression profiling and heat map of the above‐mentioned grouping of 60 fibrogenesis‐related genes.
