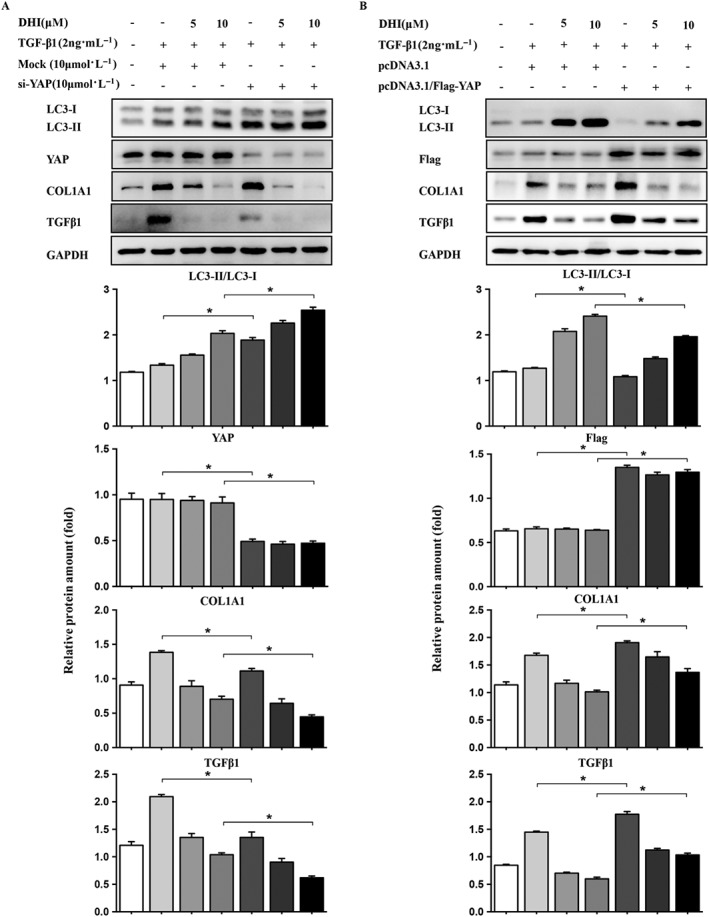
Figure 7.

The relationship between autophagy and YAP. LX‐2 cells were transfected with (A) 15 nM YAP‐siRNA or control siRNA (Mock) or (B) Flag‐YAP or vector. The protein expressions of LC3 and liver fibrosis markers were determined by immunoblotting with the indicated antibodies. GAPDH/Gapdh was used as a loading control for all western blot assays. The data are expressed as the mean ± SEM of five independent assays, #P < 0.05; significantly different from the control group and *P < 0.05; significantly different from the TGFβ1 treatment group in LX‐2 cells; ANOVA followed by Tukey's test.
