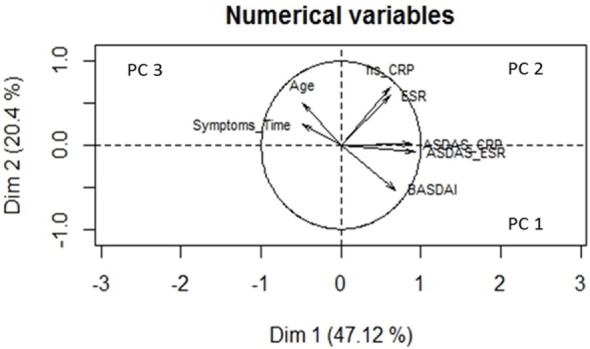
Figure 2.

Variables vector map—principal component analysis (PCA). This geometric representation of the variables is presented by arrows of a length equal to the standard deviation of the variable. The angle between each pair of arrows represents the correlation between these two variables. Small angles mean a high positive correlation, angles close to 90° no correlation, and angles close to 180° a high negative correlation with opposite directions in the plane. The PCA graph displays the graphical representation of the analyzed components matrix. From the representation, it is extracted that the explanation of the underlying factors that could somehow influence the secretory immunoglobulin A (SIgA) levels together: the first component (PC1) is a factor that represents variables associated with the evaluation of the clinical activity of the disease: Ankylosing Spondylitis Disease Activity Score (ASDAS)-C-reactive protein (CRP), ASDAS-erythrocyte sedimentation rate (ESR), and Bath Ankylosing Spondylitis Disease Activity Index (BASDAI). The second component (PC2) is a factor which group serological variables that are considered soluble markers of activity of the disease and the third component (PC3) aggregates two independent variables as they are age and symptoms that could modify the levels of SIgA. Dim, dimensions.
