FIGURE 4.

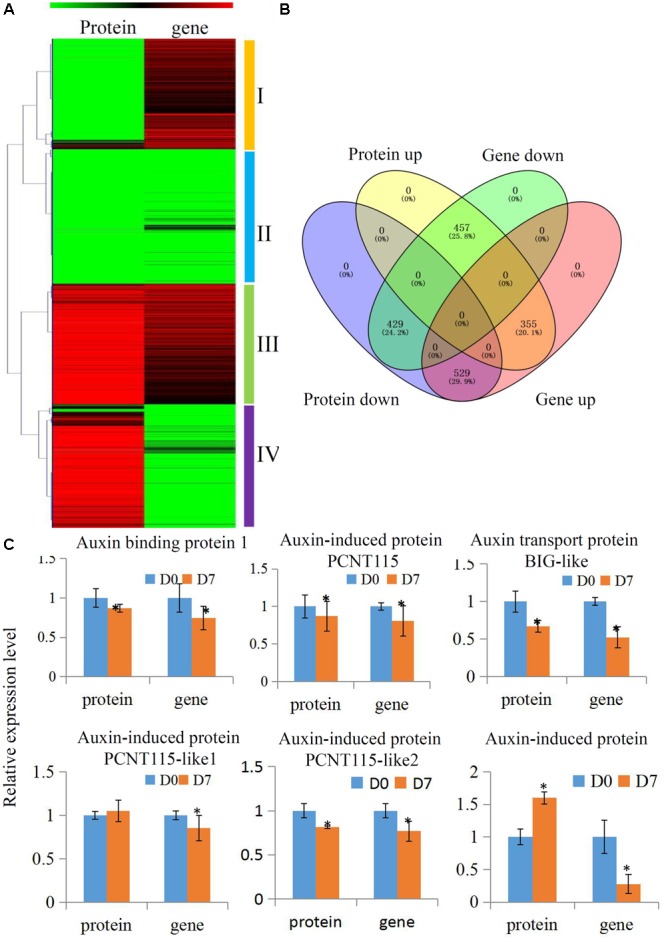
Comparative transcriptomics and proteomics of hickory during grafting process. (A) Heat map for cluster analysis of the differentially expressed proteins combining with their transcripts by K-means method. Red indicates up-regulation and green indicates down-regulation. Proteins and transcripts were grouped into four groups based abundance values as follows: (I) proteins down-regulated and transcripts up-regulated; (II) proteins down-regulated and transcripts down-regulated; (III) proteins up-regulated and transcripts up-regulated; and (IV) proteins up-regulated and transcripts down-regulated. (B) Distinct expression regulation of proteins and transcripts was showed by a Venn Diagram. (C) Relative expression level of several auxin pathway proteins of hickory during grafting process. Significant differences in expression level were indicated by “∗”.
