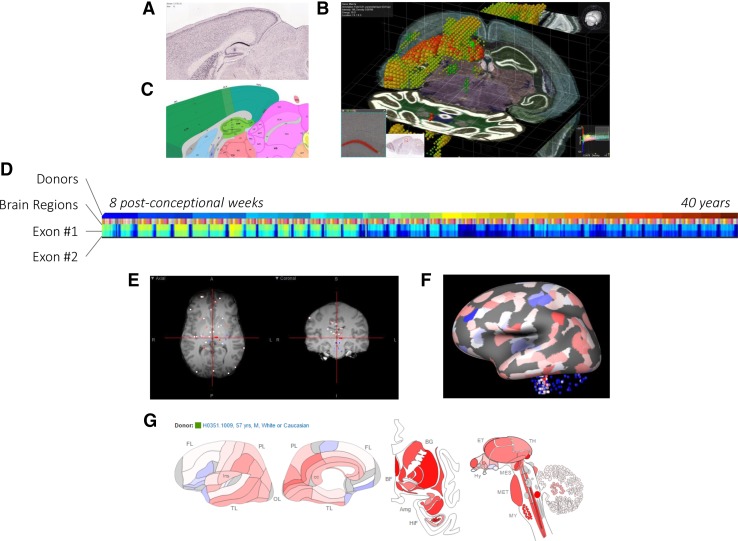
Fig. 2.
Gene expression visualization. Gene expression of spatially mapped samples can be visualized using several approaches. a Mouse gene expression data of the gene Man1a can be investigated using the original ISH sections. b BrainExplorer software allows visualization of the 3D expression volume with an overlay of the anatomical atlas and the ability to go back to the original high-resolution ISH section. c Simultaneously, viewing the ISH section and the corresponding atlas section helps in localizing gene expression to brain regions. d Heatmaps are commonly used to visualize gene expression. Expression of the two exons of the NEUROD6 gene from the BrainSpan Atlas is visualized using a heatmap in which samples are ordered according to the age of the donor. e Samples from the Allen Human Brain Atlas are associated with coordinates of their location in the corresponding brain MRI. f Using the BrainExplorer, expression values of Mecp2 can be mapped to an inflated white matter surface for better visualization of the cortex. g Alternatively, expression values can be mapped on an anatomical atlas of the human brain

