Fig. 3.
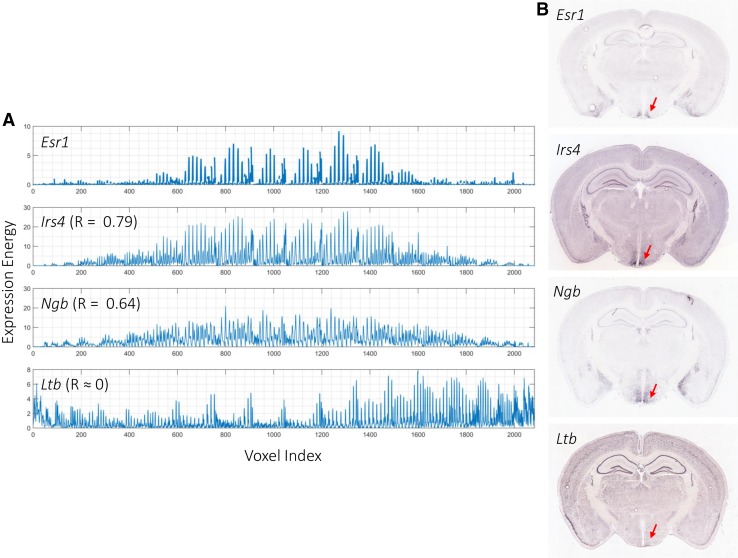
Spatial gene co-expression in the mouse brain. a Expression energy profiles of voxels in the hypothalamus region of the mouse brain using the same linear ordering. The estrogen receptor alpha (Esr1) gene shows high expression in the hypothalamus. The expression patterns of Irs4 and Ngb are highly correlated with that of Esr1 (R = 0.79 and R = 0.64, respectively). On the other hand, the expression pattern of Ltb is not correlated with that of Esr1 (R = 8.01 × 10⁻⁴). Correlation is calculated using Pearson correlation. b Esr1 and its highly correlated genes (Irs4 and Ngb) are highly expressed in the hypothalamus (red arrow), while Ltb is not

