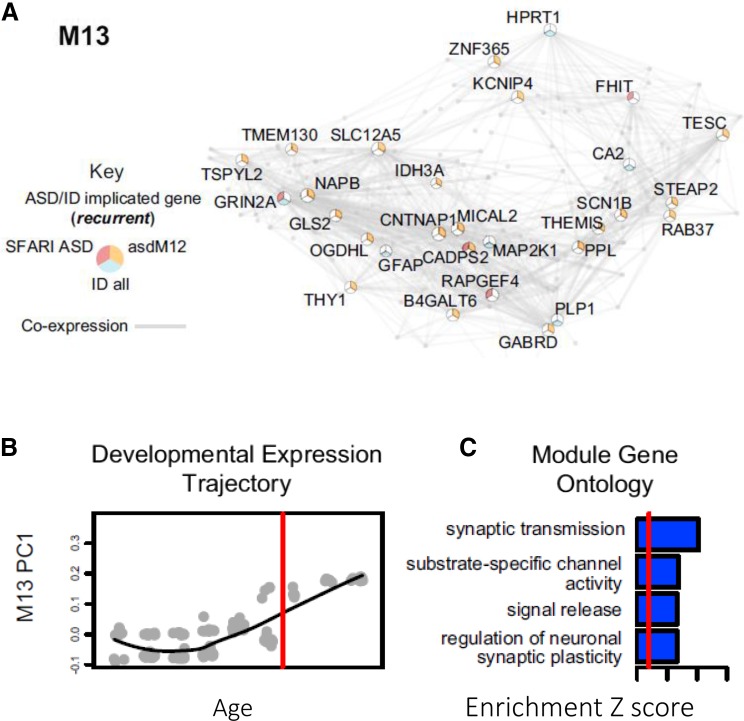
Fig. 4.
Gene co-expression networks. a Module M13 of co-expressed genes from Parikshak et al. (2013) (reprinted from Parikshak et al. Parikshak et al. 2013, Copyright (2016), with permission from Elsevier.). The shown module is significantly enriched in autism-related genes. The shown network comprises the top 200 connected genes (highest correlation) and their top 1000 connections in the subnetwork (also ordered on correlation). Genes are labeled if they are members of relevant gene sets. b Pattern of gene expression of genes in the shown module is summarized using the first principal component (eigengene). The red line indicates birth. c Gene Ontology terms enriched in the shown module. The blue bars indicate relative enrichment compared to all cortex-expressed genes in terms of Z score. The red line indicates Z = 2

