Fig. 1.
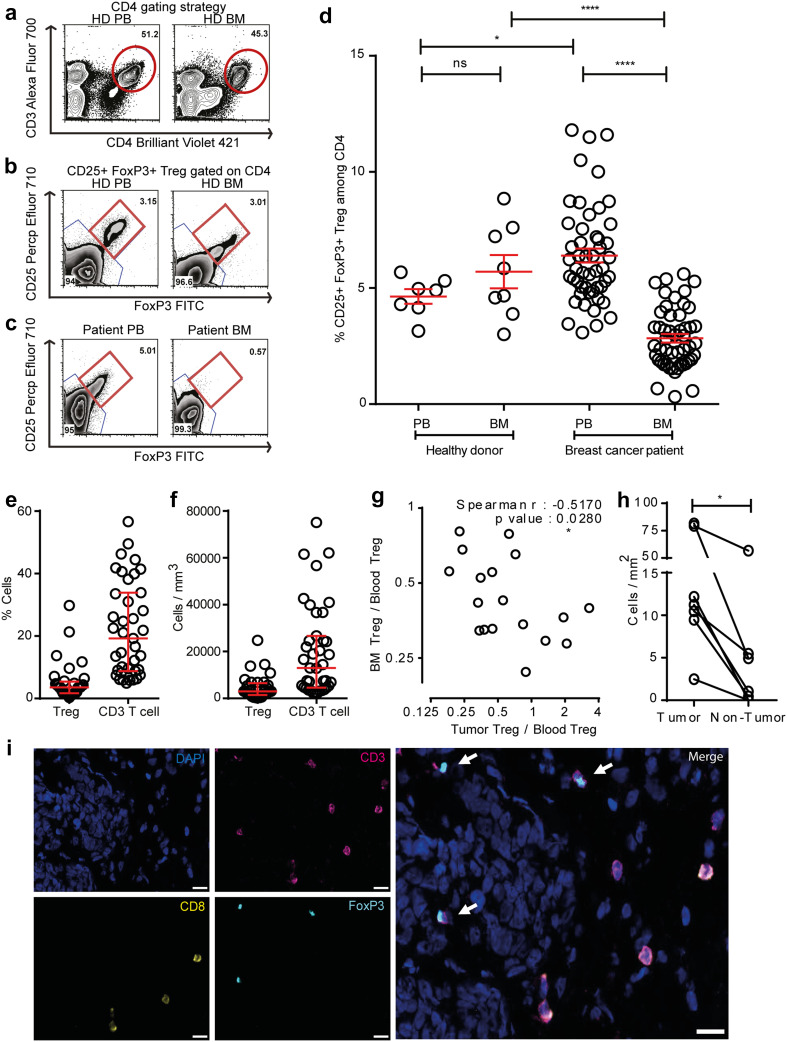
Decreased frequencies of Treg subpopulations in the BM of breast cancer patients. a Representative plot of a healthy donor showing the CD4+ T-cell gating strategy. b–c CD4+ cells were analyzed for FoxP3 and CD25 expression. CD25+ FoxP3+ cells were gated as Treg, and CD25− FoxP3− cells were gated as Tcon. Representative plots illustrating Treg frequencies in BM and PB of a healthy donor (b) and a breast cancer patient (c). Red circle and square represents the CD4 gate and CD25+ FoxP3+ Treg gate, respectively. d Cumulative data of CD25+ FoxP3+ Treg frequencies in PB and BM of all patients and healthy donors analyzed—Healthy donor PB (n = 7) and BM (n = 8), patients with matched PB and BM samples (n = 50). Data distribution in 1d is represented by mean with SEM. For healthy donors unpaired t test and for patient samples, paired t test was used for statistical analysis. Epigenetic PCR was performed on DNA isolated from tumor areas from FFPE sections obtained from 42 patients. Samples that passed quality control [Treg (n = 33) and CD3 (n = 40)] were taken into analysis. e, f Treg and CD3 T-cell percentage (e) and counts per mm3 volume of tumor (f). Data distribution is represented by median with interquartile range in e and f. g Graph bridging data of Treg frequencies in BM, PB, and tumor—ratio of Treg in BM to PB correlated to ratio of Treg in tumor to PB [for all patients with Treg frequencies >4.6% in PB (n = 18)]. Non-parametric Spearman Correlation was used for analysis (Spearman r = −0.5170). Axes are depicted on log 2 scale. h. Graph depicting Treg counts in tumor and non-tumor areas of breast tissue (n = 7). Lines connect data from individual patients. Non-parametric Wilcoxon matched pair signed rank test was used for statistical analysis. i Representative immunofluorescence staining of mammary tumor cryosection with arrows indicating CD4+ Treg and analyzed by the TissueQuest software. Cells that were DAPI+ FoxP3+ CD3+ and CD8− were defined as CD4+ Treg. Original magnification, 20×; Scale bar 20 µm

