Fig. 3.
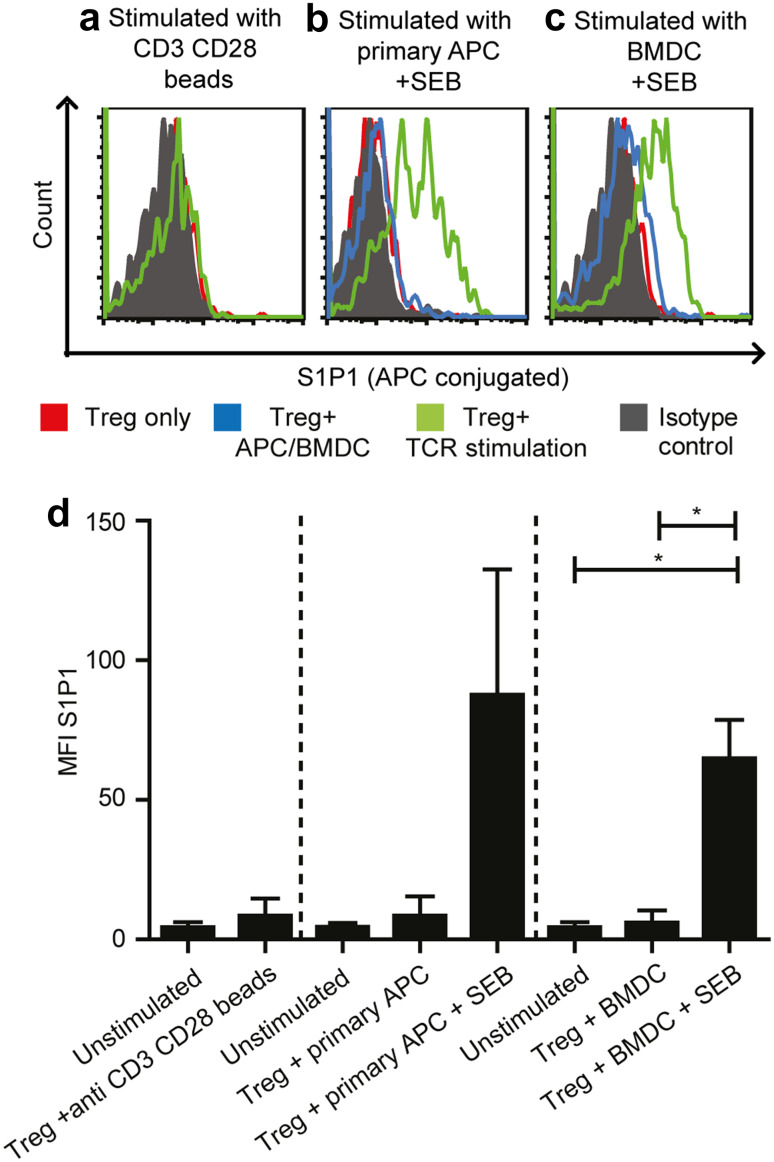
Antigen-specific TCR stimulation induces S1P1 expression on BM Treg. a Histogram of S1P1 expression on a patient’s BM Treg stimulated with anti-CD3 anti-CD28 beads (n = 3). b Histogram depicting S1P1 expression on a patient’s BM Treg stimulated with purified primary APC alone (n = 2) or primary APC with SEB (n = 5). c Histogram depicting S1P1 expression on a patient’s BM Treg stimulated with in vitro differentiated BMDC alone or BMDC with SEB (n = 4) three days after activation. Red line in the histograms depict S1P1 expression on unstimulated Treg alone. Green line in the histograms refer to S1P1 expression on TCR stimulated Treg. Blue line (only in b and c) refers to S1P1 expression on Treg that were cocultured with APC or BMDC alone without the polyclonal SEB stimulus. Solid grey histogram represents S1P1 isotype control. d Cumulative data from three different stimulation settings. Paired t test was used (when n is > or =4) for statistical analysis

