Fig. 4.
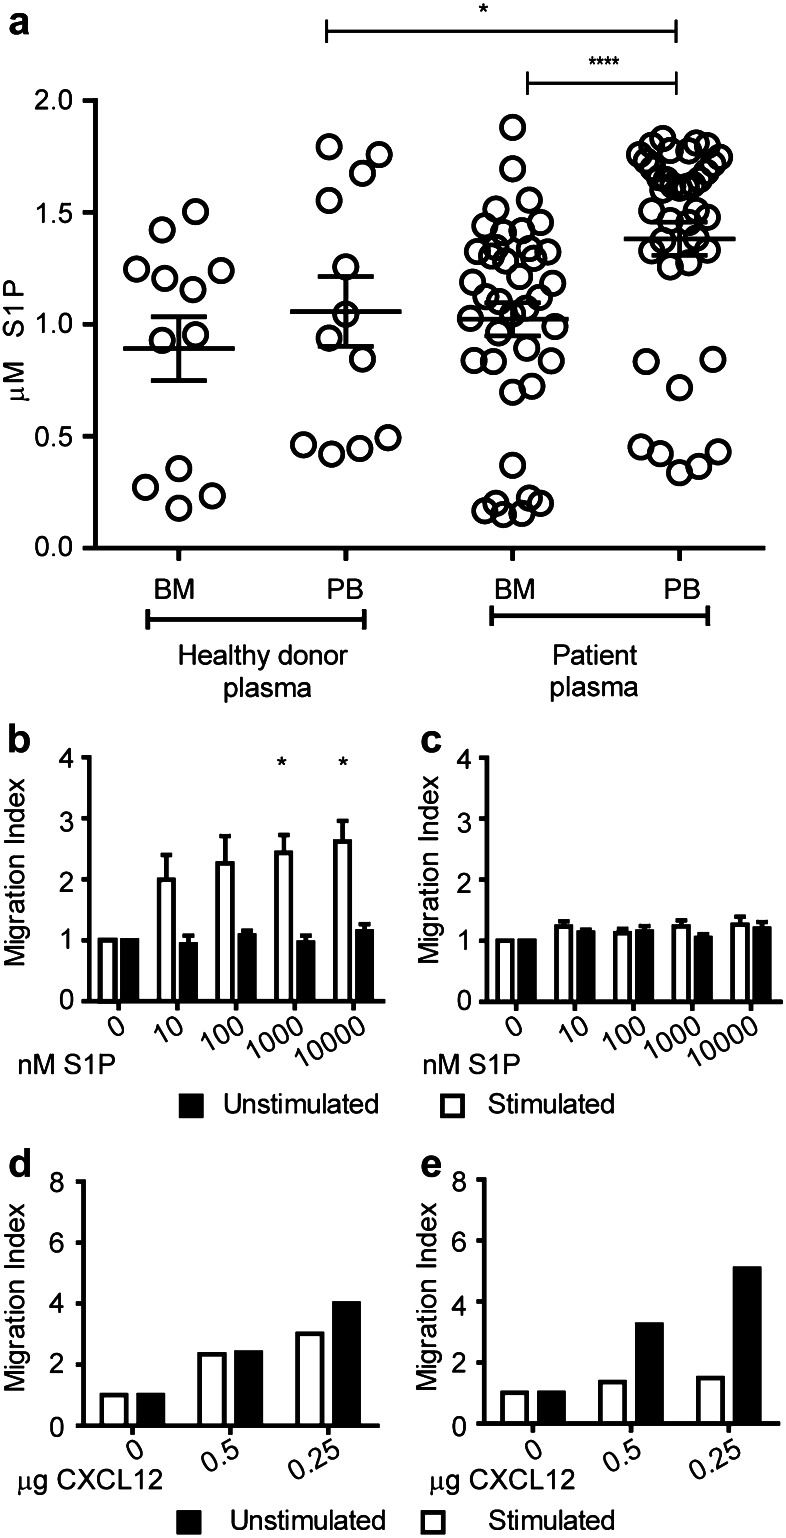
In vitro activated BM Treg migrate to S1P. a Quantification of S1P concentrations in PB and BM (n = 12) plasma of healthy donors and breast cancer patients (n = 39) by ELISA. For healthy donors unpaired t test and for patient samples, paired t test was used for statistical analysis. b–c Migration index (flourescence intensity units of cells that migrated to chemoattractant/flourescence intensity units of cells that migrated to medium alone) of BM Treg (b) and Tcon (c) towards S1P (n = 4). d–e Migration index of Treg (d) and Tcon (e) towards CXCL12 as control (n = 2). Distribution of data is represented by mean with SEM. Two-way analysis of ANOVA with repeated measurements was performed with concentration as one factor and stimulation status as the other factor. Concentration (p value 0.0010), stimulation (p value 0.0494), and interaction between concentration and stimulation (p value 0.0155) suggesting a different influence of stimulation depending on the concentration. Post hoc paired t tests showed a significant influence of stimulation in the two highest concentrations (1000 and 10,000 nM S1P)

