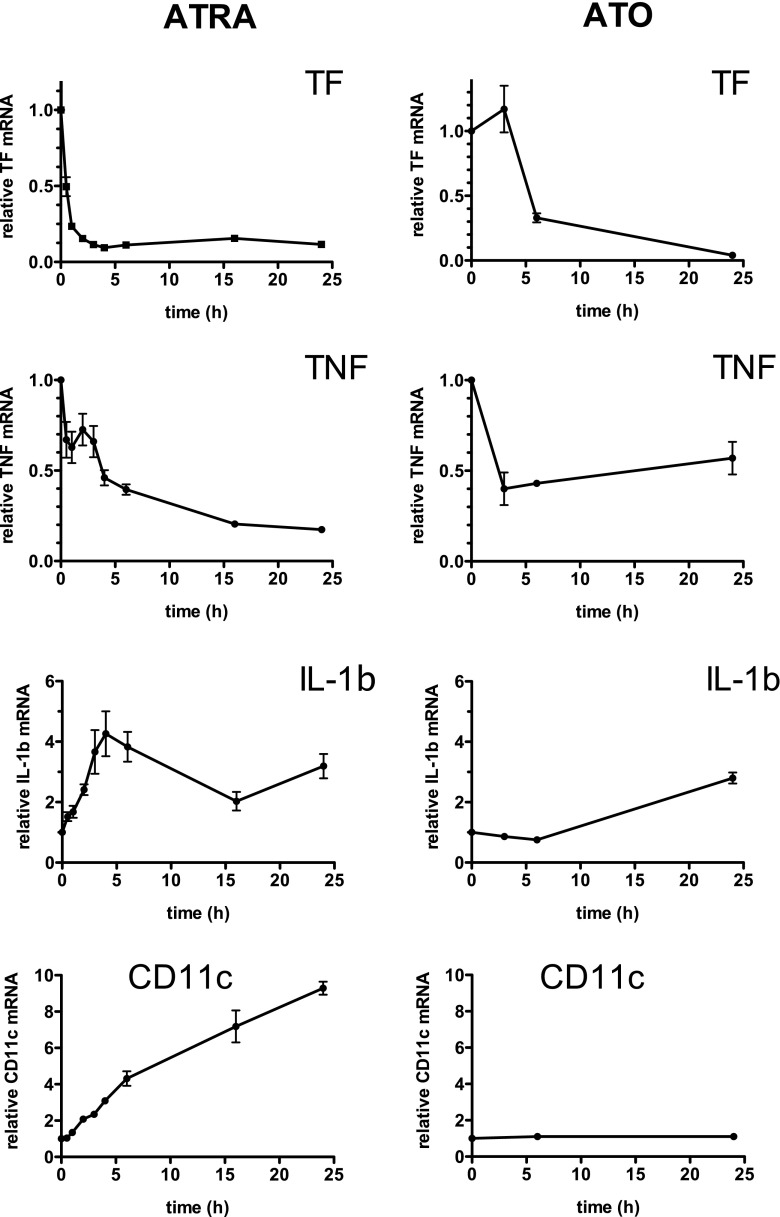
Fig. 1.
Time course of the effect of ATRA or ATO on mRNA levels of TF, TNF, IL-1β, and CD11c in NB4 cells. NB4 acute promyelocytic leukemia cells were exposed for the indicated time periods to 0.5 μM ATRA (left) or 5 μM ATO (right). Levels of mRNA were quantified by qPCR and expressed relative to that of the corresponding mRNA in control (untreated cells, incubated 24 h in medium alone) NB4 cells. The results are the means ± SEM of at least four independent experiments

