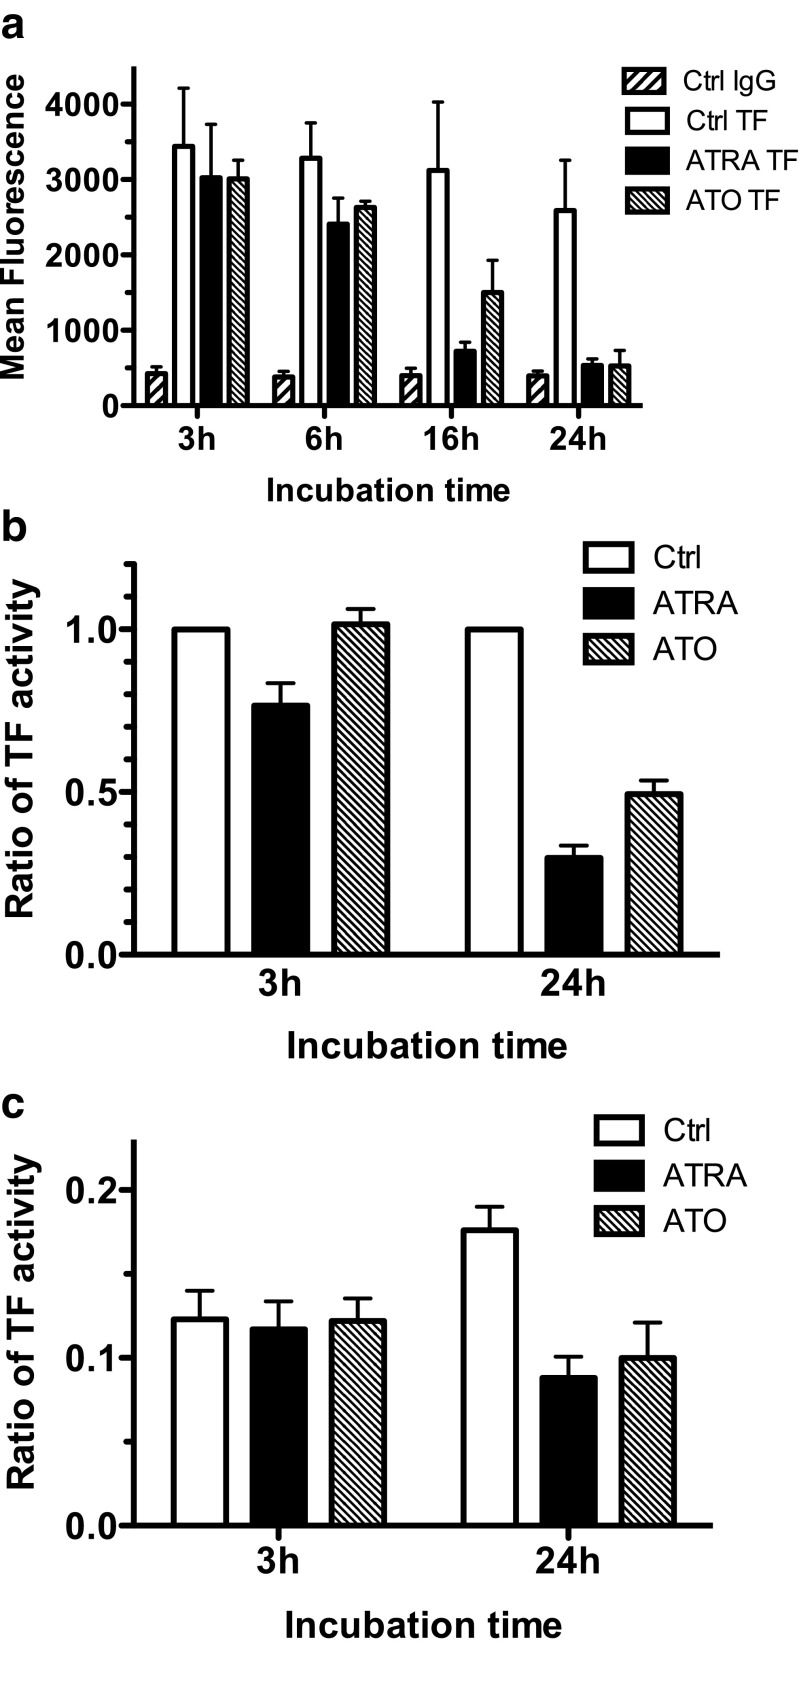
Fig. 3.
Effect of ATRA and ATO on TF antigen and activity of NB4 cells and NB4-cell-derived microparticles. a NB4 cells were exposed for the indicated time periods to 0.5 μM ATRA or 5 μM ATO. After the indicated time periods, TF antigen on the NB4 cell surface was analyzed by flow cytometry. “Ctrl IgG” are flow cytometry results obtained with an APC-labeled isotope matched control antibody and “Ctrl TF” are flow cytometry results obtained with APC-labeled antibodies on unexposed NB4 cells. Results are expressed as means ± SEM of at least four independent experiments. The reduction in TF antigen at 24 h in the ATRA or ATO treated cells with respect to the unexposed cells (Ctrl TF) was significant with p values below 0.01. b and c TF activity of NB4 cells (b) or NB4 cell-derived microparticles (c) after 3 or 24 h exposure to 0.5 μM ATRA or 5 μM ATO. All the results of b and c are expressed as ratio of TF activity as compared to that of unexposed NB4 cells at the same time point. The results are the means ± SEM of five to seven independent experiments. The reduction in TF activity at 24 h in the ATRA- or ATO-treated cells or derived microparticles with respect to the unexposed cells (Ctrl) or their microparticles was significant with p values below 0.01

