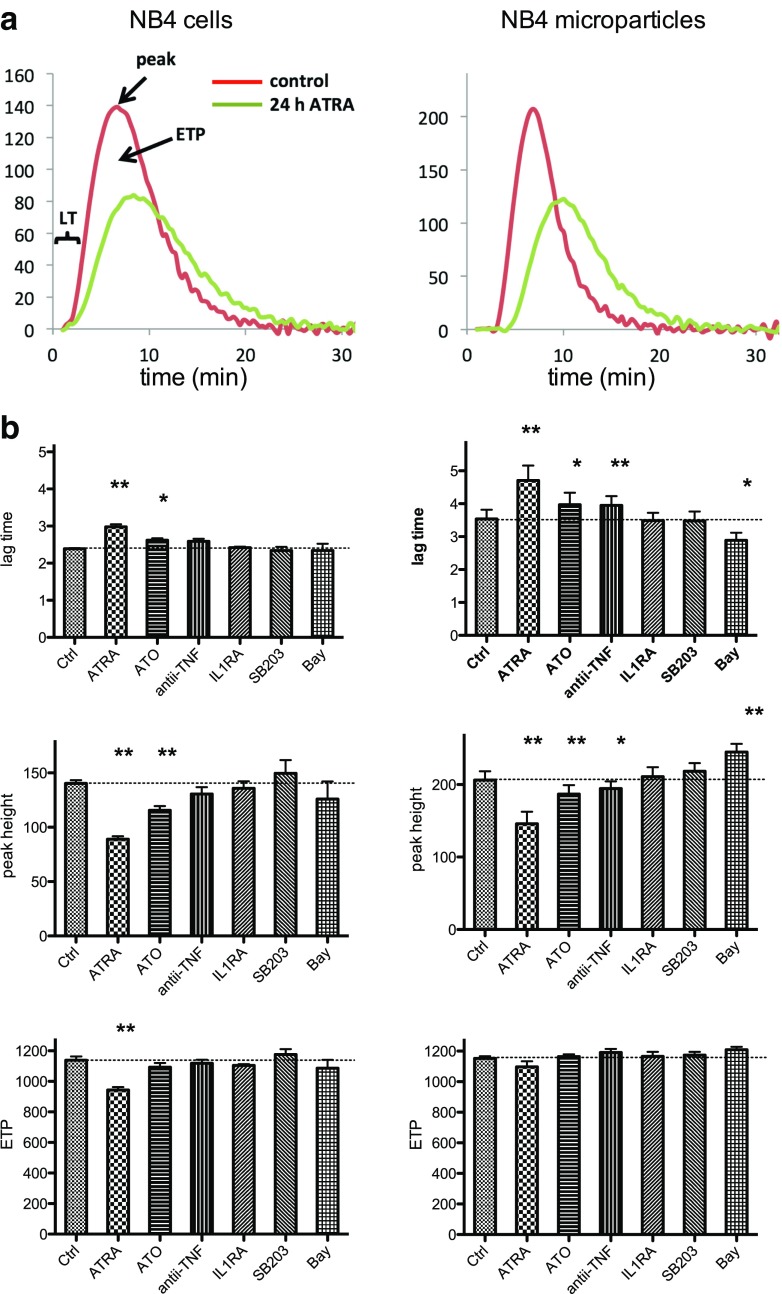
Fig. 4.
Effect of the agents investigated on procoagulant activities of NB4 cells or NB4 cell-derived microparticles as assessed with calibrated automated thrombography. NB4 cells were exposed for 24 h to the indicated agent and procoagulant activities of NB4 cells (left) or NB4 cell-derived microparticles (right) assessed with the CAT assay. a Typical thrombogram (CAT) of unexposed (red) or ATRA treated (green) NB4 cells or NB4 cell-derived microparticles. LT lag time (= time elapsed before thrombin burst), peak height (= maximal thrombin concentration), and ETP: area under the curve (= total amount of thrombin action). b Histograms of results obtained regarding lag time, peak height, and ETP with cells (left) or cell-derived microparticles (right) obtained from NB4 cells exposed to 0.5 μM ATRA, 5 μM ATO, 10 μg/ml of adalimumab (anti-TNF: a TNF inhibitory antibody), 10 μg/ml of anakinra (IL1RA: an IL-1 receptor antagonist), 10 μM SB203580 (SB203: a p38 inhibitor), or 100 μM BAY11-7085 (Bay: a NF-κB inhibitor). Results are presented as the means ± SEM of four to six independent experiments. Differences were analyzed using the paired Student’s t test. (*p < 0.05 and **p < 0.01)

