Fig. 5.
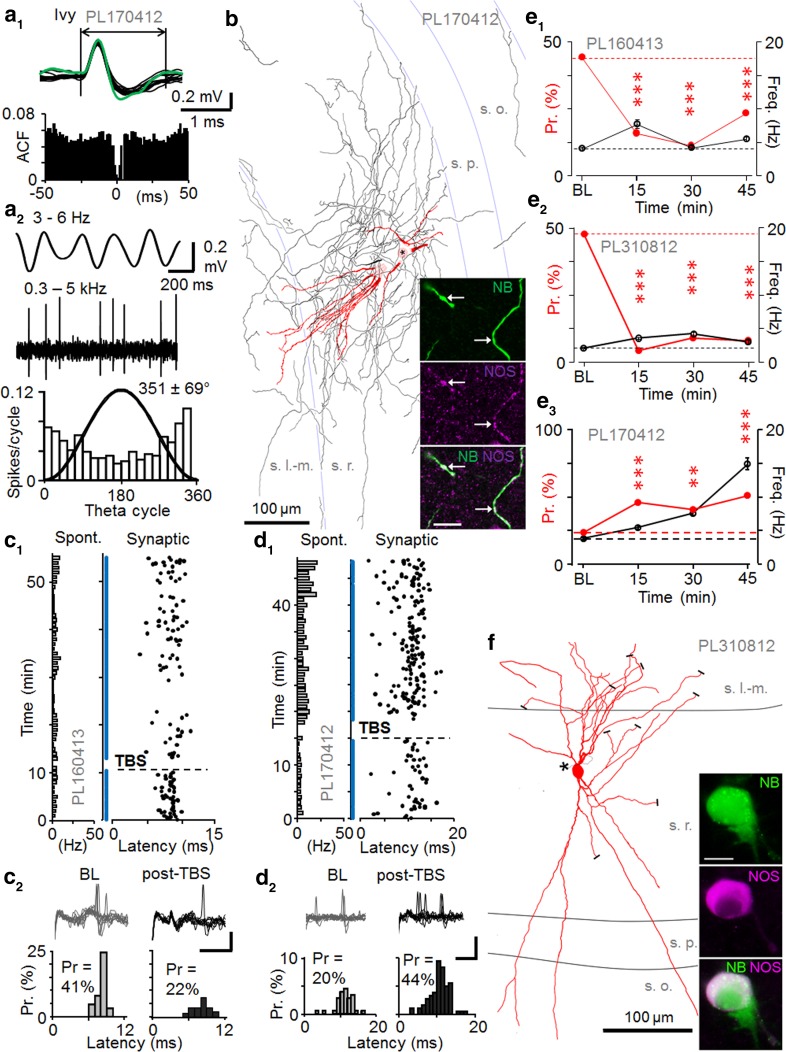
Persistent potentiation or depression of synaptic excitation in NOS+ ivy cells. a Spontaneous firing of an ivy cell (PL170412). a1 Top superimposed spontaneous (black) and synaptically-evoked (green) spikes in the cell (spike waveform >1.5 ms). Bottom autocorrelogram of spontaneous firing. a2 Spiking during LFP theta frequency (3–6 Hz) oscillations. Top band-pass filtered LFP (3–6 Hz) and ivy cell spikes (band-pass filtered at 0.3–5 kHz). Bottom spike histogram (18° bins) shows slight firing preference at the LFP trough (black line sine wave). b Partial reconstruction of the dendrites (red) and axon (black both from four 70 µm-thick sections) of the ivy cell with cell body in stratum radiatum (s.r.). White matter is to the right. Damage to the soma by the labelling resulted in a spillage of neurobiotin, but all the dendrites converged to one site (circle, star). The axon was most dense in s.r, but collaterals were present in all layers. Confocal microscopic images show NOS immunopostive (purple) neurobiotin-labeled (NB, green) dendrites. Scale 10 µm. c–d Ivy cells with LTD-like depression or LTP-like potentiation of action potential probability. c Persistent depression of spike probability by TBS (horizontal line) with no significant change in spike latency. c1 Stimulation cycles with failures to evoke spike are shown by blue dots. Horizontal bars on left indicate spontaneous firing of the cell (1 min bins). c2 Synaptically-evoked spikes in baseline and following TBS (30 min). Scales 0.2 mV, 3 ms. Top superimposed traces. Bottom histograms of spike probability (Pr) and delay (latency). Pr decreased from baseline (P < 0.005, Chi square test). d Another ivy cell showing persistent potentiation. d1 Synaptically-evoked spike probability and delay (black) with failures (blue), and spontaneous firing on the left. d2 Top traces in baseline and post-TBS. Scales 0.5 mV, 10 ms. Bottom histograms of the evoked spike occurrence. Probability (Pr) increased after TBS (P < 0.01, Chi square test). e Synaptic spike probability (red) at different times in three recorded and identified NOS+ ivy cells (e1–e3). Average spontaneous firing in parallel shown in black. Changes in Pr are compared to baseline (Chi square test). Spontaneous firing level was significantly changed long term from baseline in PL170412 (at 30 and 45 min P < 0.005, ANOVA with Bonferroni test). f Reconstruction of the ivy cell PL310812 with soma in stratum radiatum that showed LTD of spike probability (see e2). Dendrites (red) are shown from three 70 μm thick sections, cut dendrites indicated with black bars, and asterisk shows the origin of the axon (black). Inset the neurobiotin (NB, green) labelled soma is immunopositive for NOS (purple); a microglial cell attached at lower right took up neurobiotin. Scale 10 μm

