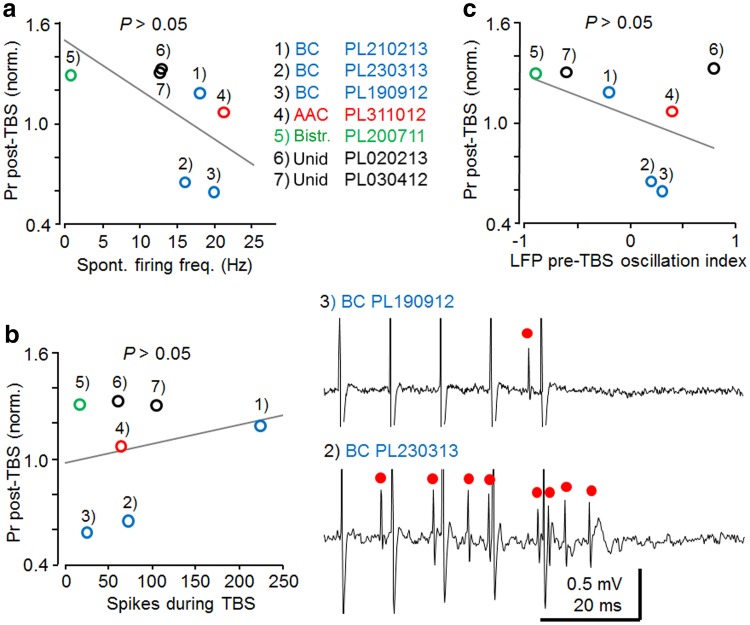
Fig. 6.
The effect of postsynaptic cell firing and hippocampal network oscillatory states on plasticity in fast-spiking interneurons. Individual cells are annotated and cell types shown in different colors as indicated. a Spontaneous firing level of the recorded fast-spiking interneurons and baseline-normalized plasticity (>15 min post-TBS) failed to show significant correlation (n = 7, Pearson’s test). The correlation coefficient suggests linear relationship between the variables (r 2 = 0.36, n = 7, Pearson’s test), but correlation is not significant (P > 0.05). b The firing level of the cells during afferent TBS, on average, did not explain whether LTP or LTD was generated in the fast-spiking interneurons. However, note differences in the direction of plasticity for PV+ basket cells with mean rate >200 Hz vs. mean rate <100 Hz. Left the plot shows averaged baseline-normalized spike probability (Pr) post-TBS and the number of spikes generated during TBS (r 2 = 0.05). No correlation was found between the factors (n = 7, Pearson’s test). Right sample traces (one theta burst of 5 pulses at 100 Hz) in the two LTD-exhibiting PV+ basket cells with very different TBS-associated firing. Red dots mark evoked action potentials. c Relationship of the LFP index for pre-TBS, based on wavelet power spectrogram (1 s before TBS), and long-term plasticity of evoked spike probability (Pr) in the fast-spiking interneurons. Index values of 1 and −1 represent spectral power components only in the frequency ranges of 3–6 or 1–3 Hz, respectively; 0, represents equal average power in both frequency ranges. As a group, the fast-spiking cells did not show correlation between pre-TBS LFP oscillatory components and the direction of plasticity (n = 7, Pearson’s test) (r 2 = 0.19)

