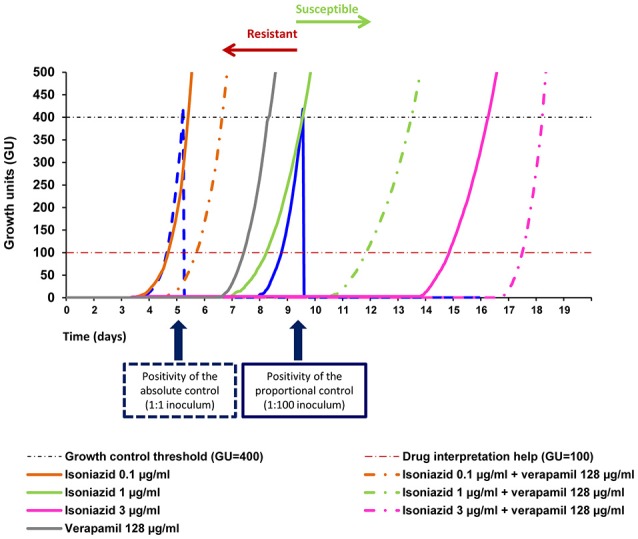
Figure 5.

Quantitative drug susceptibility testing of isoniazid for the strain MtbPT11, in the presence or absence of verapamil. Quantitative drug susceptibility testing of isoniazid was conducted using the BACTEC 960 system and the Epicenter V5.80A software equipped with the TB eXIST module. Absolute control is given by the dotted blue curve (undiluted strain 1:1) and the proportional control is given by the continuous blue curve (strain diluted 1:100). The orange, yellow, pink, and green full curves correspond to the growth curves of the strain in the presence of only isoniazid; the respective colored dashed curves corresponded to the growth curves of the strain in the presence of isoniazid and verapamil; Verapamil alone does not inhibit the growth of the strain (gray curve). At the time of growth of the proportional growth control (GU = 400—black dashed line), the comparison between this tube and the tubes containing the drugs(s) was performed. If the GU of the tubes containing the drug were >100 (red dashed line), they were considered to be resistant to that concentration. If the GU of the tube containing the drug was <100 they were considered susceptible. Isoniazid was tested at 0.1, 1, 3, and 10 μg/ml with and without half MIC of verapamil.
