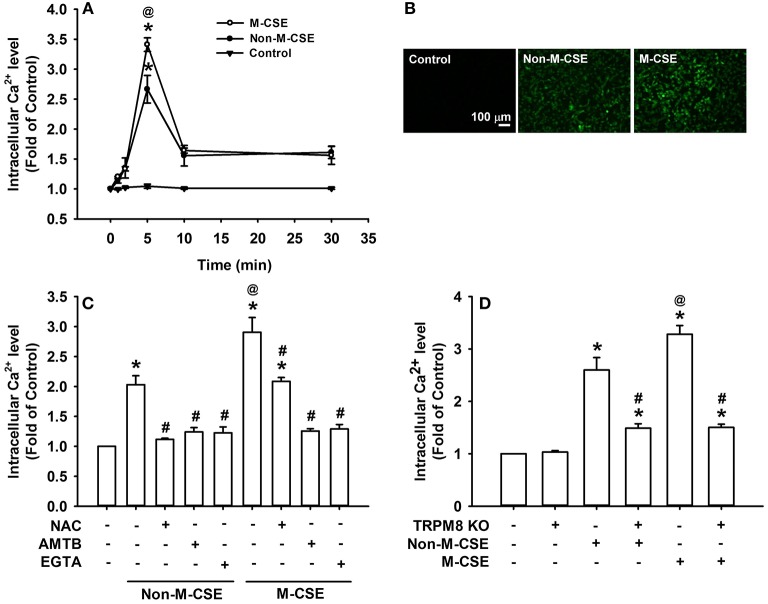
Figure 3.
Roles of ROS and TRPM8 in the increased intracellular Ca2+ level induced by M-CSE and Non-M-CSE in HBECs. Intracellular Ca2+ levels were measured by Fluo-8 fluorescent probe assay. (A) Cells were exposed to medium alone (control), 1% Non-M-CSE, or 1% M-CSE for 1, 2, 5, 10, and 30 min. (B) Representative images of fluorescence-positive cells at 5 min after exposure. (C) Cells were pretreated with N-acetyl-cysteine (NAC), AMTB, or ethylene glycol tetraacetic acid (EGTA) for 1 h and then exposed to medium alone, 1% Non-M-CSE, or 1% M-CSE for 5 min. (D) Cells were transfected with control plasmid or TRPM8 Double Nickase plasmid (KO) and then exposed to medium alone, 1% Non-M-CSE, or 1% M-CSE for 5 min. Data from each group are means ± SEM from four independent experiments. *p < 0.05 vs. the medium group (A,C,D); @p < 0.05 vs. the Non-M-CSE group without pretreatment (A,C,D); #p < 0.05 vs. the same type of CSE group without pretreatment (C,D).

