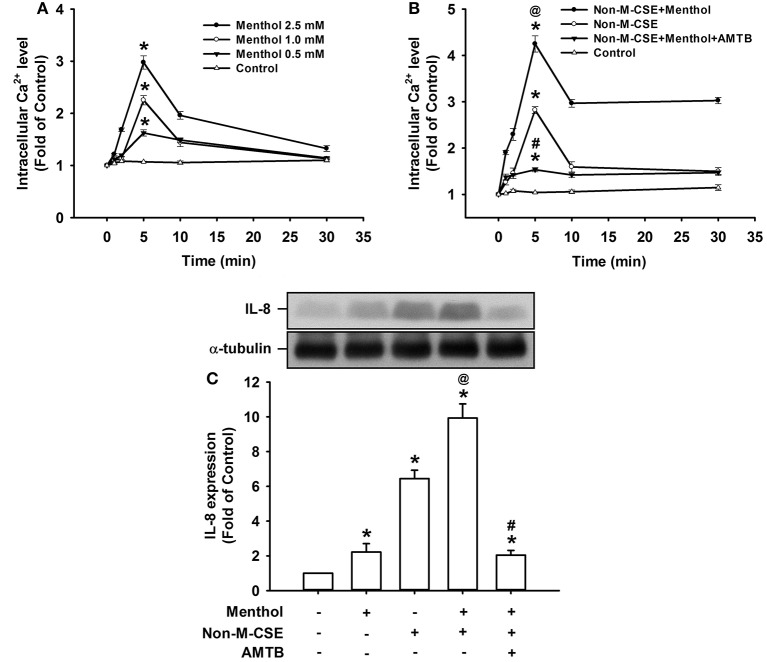
Figure 6.
Responses of intracellular Ca2+ and IL-8 to menthol alone or in combination with Non-M-CSE in HBECs. Intracellular Ca2+ levels were measured by Fluo-8 fluorescent probe assay at 1, 2, 5, 10, and 30 min after exposure. IL-8 levels were analyzed by Western blot at 24 h after exposure. Pretreatment with AMTB was performed 1 h prior to exposure. Cells were exposed to medium alone (control) or menthol (0.5–2.5 mM) (A), medium alone, 1% Non-M-CSE, or a combination of Non-M-CSE and menthol (2.5 mM) (B), or medium alone, menthol (2.5 mM), 1% Non-M-CSE, or a combination of Non-M-CSE and menthol (C). Data in each group are means ± SEM from four independent experiments. *p < 0.05 vs. the medium group; @p < 0.05 vs. the Non-M-CSE group without pretreatment; #p < 0.05 vs. the combination group without pretreatment.

