
Figure 2.
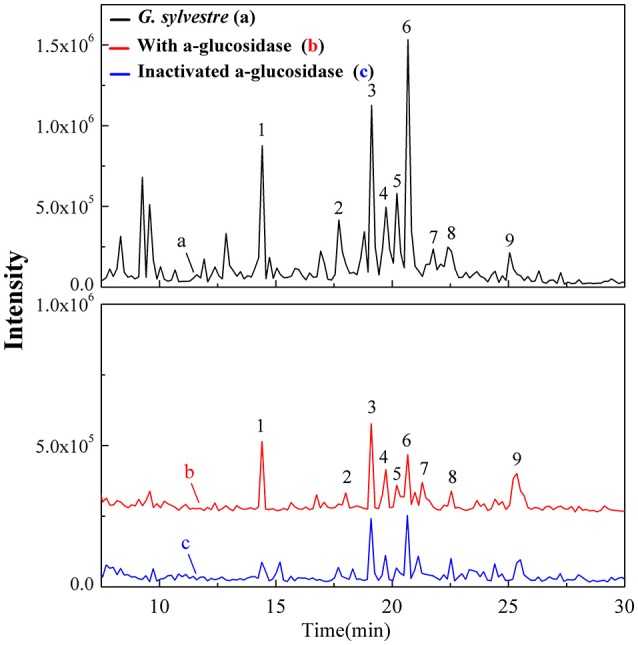
The total ion chromatograms for the UF-HPLC-MS screening of the chemical constituents in the G. sylvestre. The black solid line (a) represents HPLC profiles of the extract of G. sylvestre without ultrafiltration; and the red line (b) and blue line (c) represent HPLC profiles of the G. sylvestre with activated and inactivated Top I, respectively.