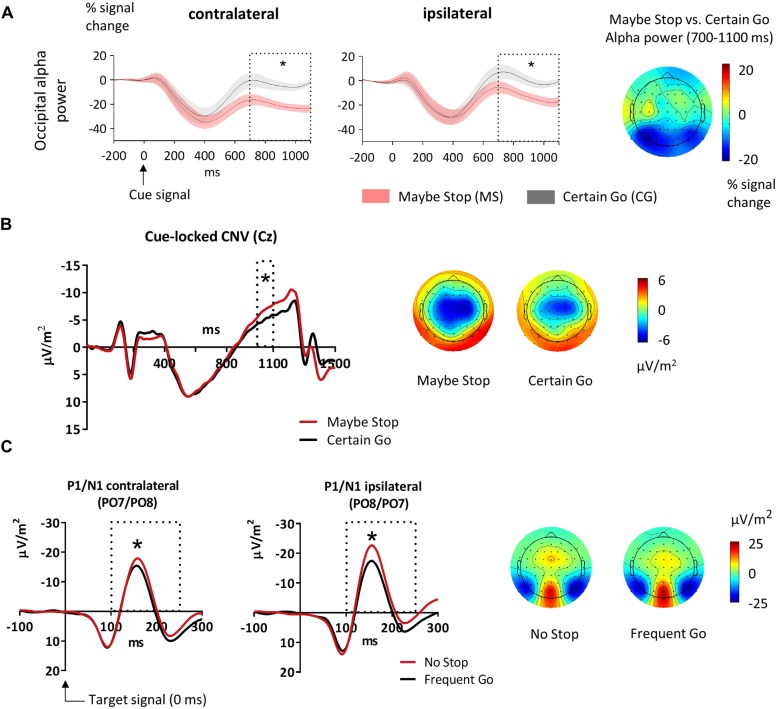
Figure 2.
Effects of attentional gating. (A) Alpha (9–14 Hz) power in the cue-target interval for the Maybe Stop (red) and the Certain Go condition (black) at occipital clusters. The analyzed time-window (700–1100 ms) is displayed as dotted box. The cue appeared at 0 ms and the target stimulus at 1100 ms. Alpha power was lower in MS- than CG-trials both contralateral and ipsilateral to the upcoming, possibly lateralized target. The SEM is displayed as shaded area. The topographic plot to the right shows the scalp distribution of the alpha band as difference between Maybe Stop- and Certain Go-trials. (B) Contingent negative variation (CNV) in the cue-target interval, measured at Cz. Displayed are MS- (red) and CG-trials (black). In the analyzed time-window (1000–1100 ms, dotted box) the CNV was increased in MS- compared to CG-trials. The target stimulus appeared at 1100 ms. The topographic plots display mean activity between 1000 ms and 1100 ms. (C) Target-evoked P1/N1 at sites contra- and ipsilateral to the visual stimuli. In the analyzed time-window (100–250 ms, dotted box) N1 was increased for No Stop- than Frequent Go-trials. The topographies display mean activity between 130–170 ms. Here 0 ms indicates time of target-onset. Significant effects are stressed with asterisks.

