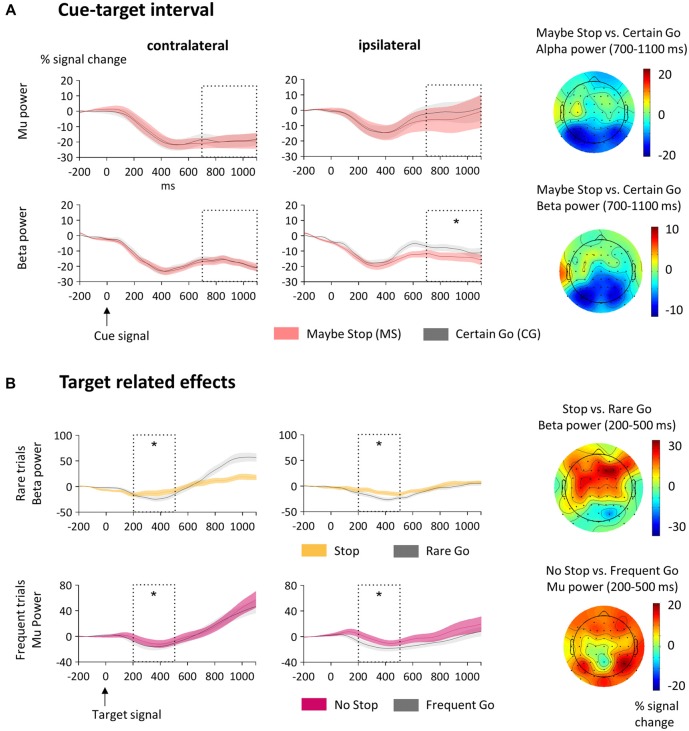
Figure 3.
Sensorimotor activity. (A) Activity in the cue-target interval. Here mu (9–14 Hz; upper row) and beta (15–25 Hz; lower row) power at sensorimotor clusters contralateral and ipsilateral to the standard motor response is displayed. The analyzed time-window (700–1100 ms) is indicated as dotted box and the SEM is shown as shaded area. The cue appeared at 0 ms and the target stimulus at 1100 ms. Mu was lower on the contralateral than on the ipsilateral side but did not differ between MS- and CG-trials. Beta decreased in MS-trials on the ipsilateral side only. The topographic plots to the right show the scalp distribution of the alpha and beta bands as differences between MS- and CG-trials. (B) Target-related effects of sensorimotor mu and beta. The analyzed time-window (200–500 ms) is indicated as dotted box. Here 0 ms indicates time of target-onset. Upper row: Beta power was higher in Stop- than Rare Go-trials at both sensorimotor clusters contralateral and ipsilateral to the motor response. Lower row: Mu power was higher in No Stop- than Frequent Go-trials at contralateral and ipsilateral sensorimotor clusters. The topographic plots to the right show the scalp distribution of the alpha and beta bands as differences between Stop- and Rare Go-, or respective No Stop- and Frequent Go-trials. Significant effects are stressed with asterisks.

