Figure 5.
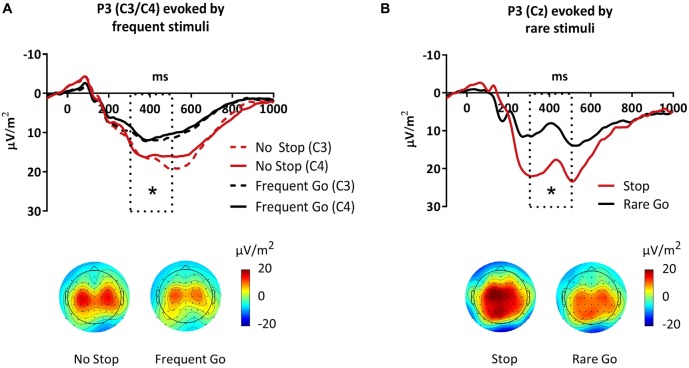
P3 evoked by frequent and rare target-stimuli. The analyzed time-window (300–500 ms) is shown as dotted box. The topographies display mean activity between 300 ms and 500 ms in the different conditions. (A) P3 evoked by frequent stimuli was increased in No Stop- compared to Frequent Go-trials at both C3 and C4. (B) P3 evoked by rare stimuli was increased in Stop- compared to Rare Go-trials at Cz. Significant effects are stressed with asterisks.

