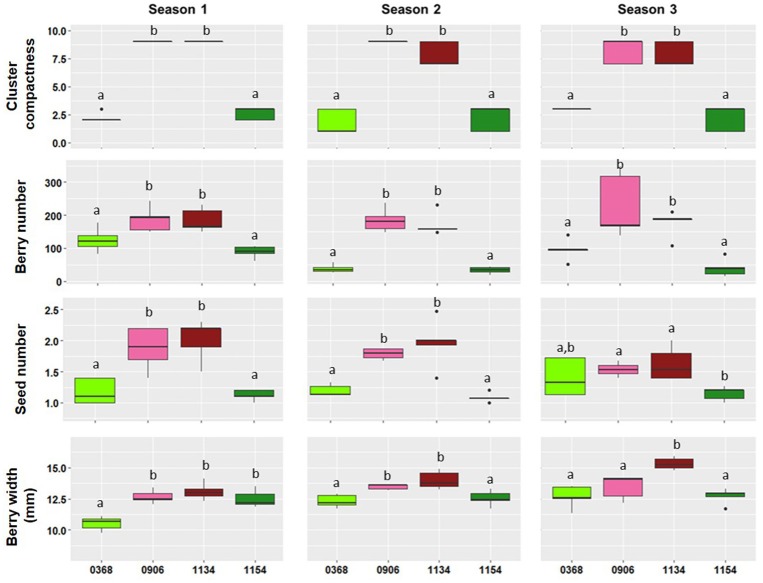
Figure 1.
Boxplots showing the phenotypic distribution of four traits [Cluster compactness (OIV-rating), Berry number per cluster, Seed number per berry, and Berry width (mm)] for the four clones analyzed (368, 906, 1134, and 1154) during three different seasons. Different lowercase letters within a plot indicate a significant difference among clones according to Fisher's LSD-tests (p ≤ 0.05).

