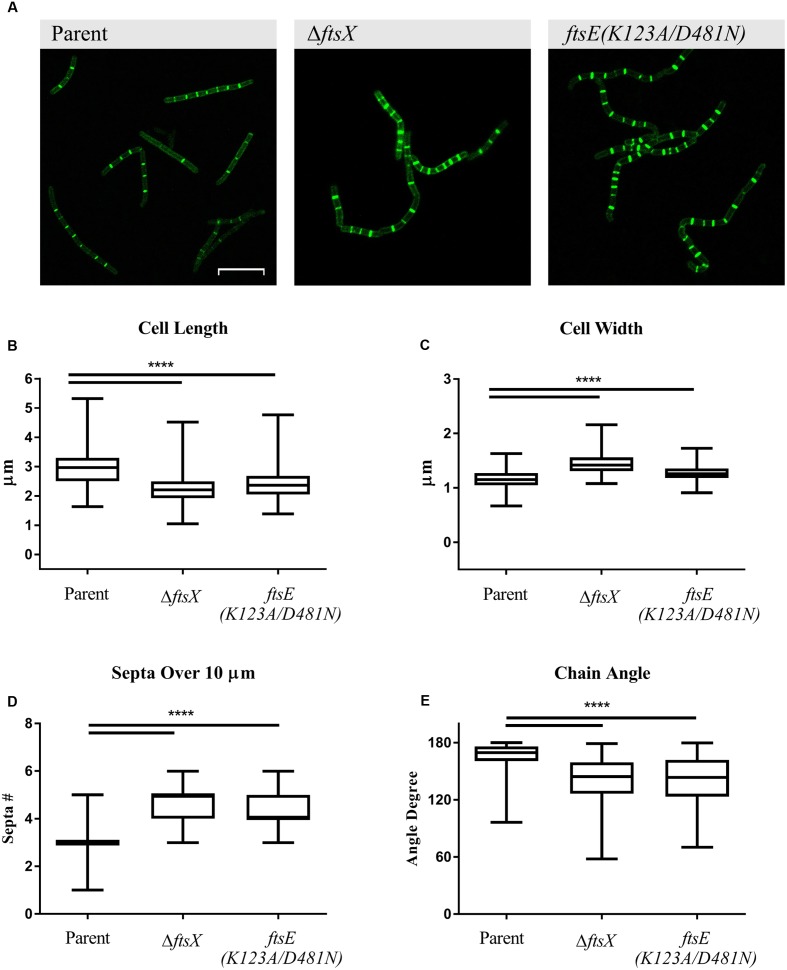
FIGURE 1.
Quantification of Bacillus anthracis parent strain, ΔftsX, or ftsE(K123A/D481N) vegetative cell morphological features of cell length, width, number of septa in a given distance, and angles formed by bacterial chains. (A) B. anthracis parent strain, B. anthracis ΔftsX strain, and B. anthracis ftsE(K123A/D481N) strain visualization of incorporated EDA after “Click-iT” reaction using Alexa Fluor 488 azide. Comparison of (B) individual cell length, measured as the distance from a septum to an adjacent septum in a bacterial chain, (C) individual cell width, measured at the midpoint of the bacterial rod, (D) total number of septa in a bacterial chain, measured over an arbitrarily chosen distance of 10 μm, and (E) chain angle, as measured from end-middle-end of a chain of bacterial cells. Confocal microscopy images of untreated B. anthracis parent, ΔftsX, and ftsE(K123A/D481N) strains are shown as EDA+Alexa Fluor 488 green fluorescence images at 63X magnification. Scale bar represents 10 μm. Images are representative of n = 3 separate experiments with 10–20 images per experiment acquired per strain. Comparisons were made between B. anthracis parent strain, ΔftsX, and ftsE(K123A/D481N). Measurements of individual vegetative cells and bacterial chains were determined using Image J (Schneider et al., 2012). A total of 100 measurements was collected each for bacterial length and width for a given strain and condition per experiment. A total of 50 measurements was collected for determining the number of septa in an arbitrarily chosen distance of 10 μm and for chain angle determination for each strain and condition per experiment. Results are represented as a box-and-whisker plot with data points represented from minimum to maximum; n = 3 separate experiments from which data was collected. Data were analyzed using a Mann–Whitney test, ∗∗∗∗p < 0.0001.

