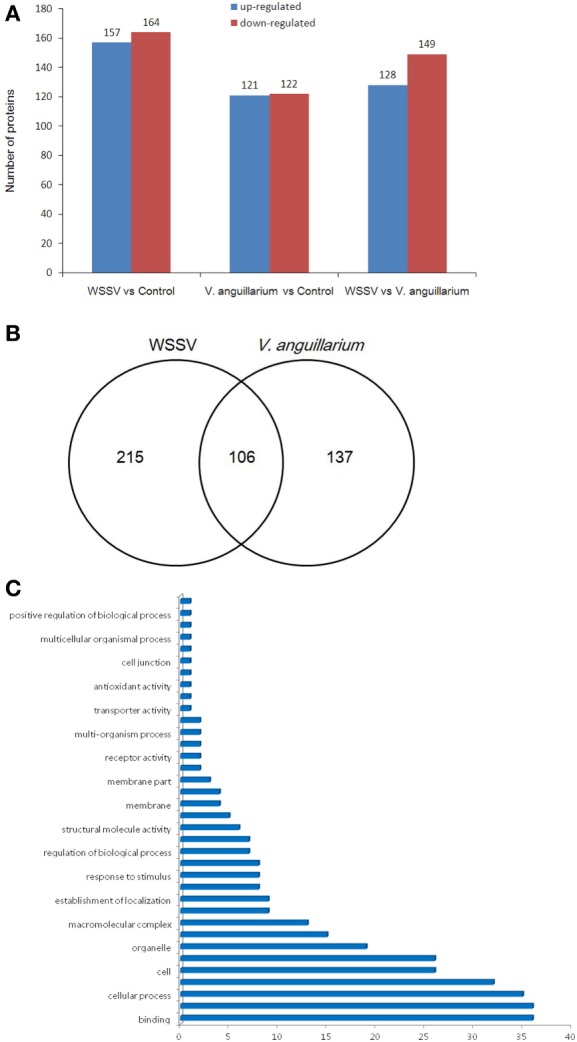
Figure 3.

The differentially expressed proteins were evaluated by isobaric tags for relative and absolute quantitation analysis. The numbers represent the proteins that were upregulated or downregulated (more than 1.2-fold) compared with the control or Vibrio alginolyticus group (A). Venn diagram of differentially expressed genes (B). The numbers represented the proteins upregulated or downregulated (more than 1.2-fold) compared with the control. The statistics of gene ontology enrichment of the 106 proteins up- or downregulated significantly in white spot syndrome virus (WSSV) and V. alginolyticus infection (C).
