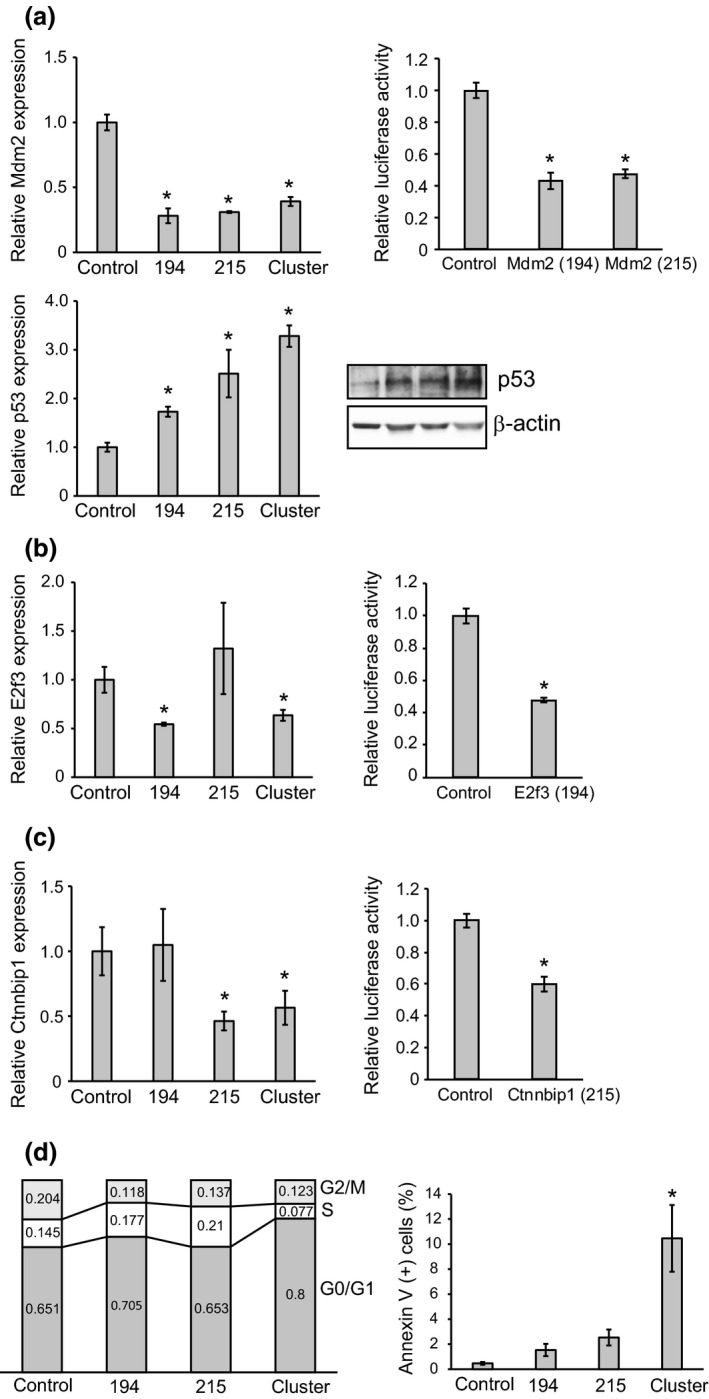
Figure 3.

Relative expression levels of target genes of miR‐194 and miR‐215 in intestinal tumor organoids. (a) Quantitative RT‐PCR analysis of Mdm2 normalized to Gapdh and relative luciferase activities of the constructs containing the target sites of miR‐194 and miR‐215 in the 3′ UTR of the Mdm2 gene and the constructs lacking these regions (upper). Quantitative analysis for western blotting of p53 normalized to β‐actin in intestinal tumor organoids transfected with miR‐194, miR‐215 and the cluster (lower). (b) Quantitative RT‐PCR analysis of E2f3 normalized to Gapdh in intestinal tumor organoids transfected with miR‐194, miR‐215 and the cluster (left). Relative luciferase activities of the construct containing the target site of miR‐194 in the 3′ UTR of the E2f3 gene and the construct lacking this region (right). (c) Quantitative RT‐PCR analysis of Ctnnbip1 normalized to Gapdh in intestinal tumor organoids transfected with miR‐194, miR‐215 and the cluster (left). Relative luciferase activities of the construct containing the target site of miR‐215 in the 3′ UTR of the Ctnnbip1 gene and the construct lacking this region (right). (d) Cell cycle assay and apoptosis assay of intestinal tumor organoids transfected with miR‐194, miR‐215 and the cluster. *P < 0.05.
