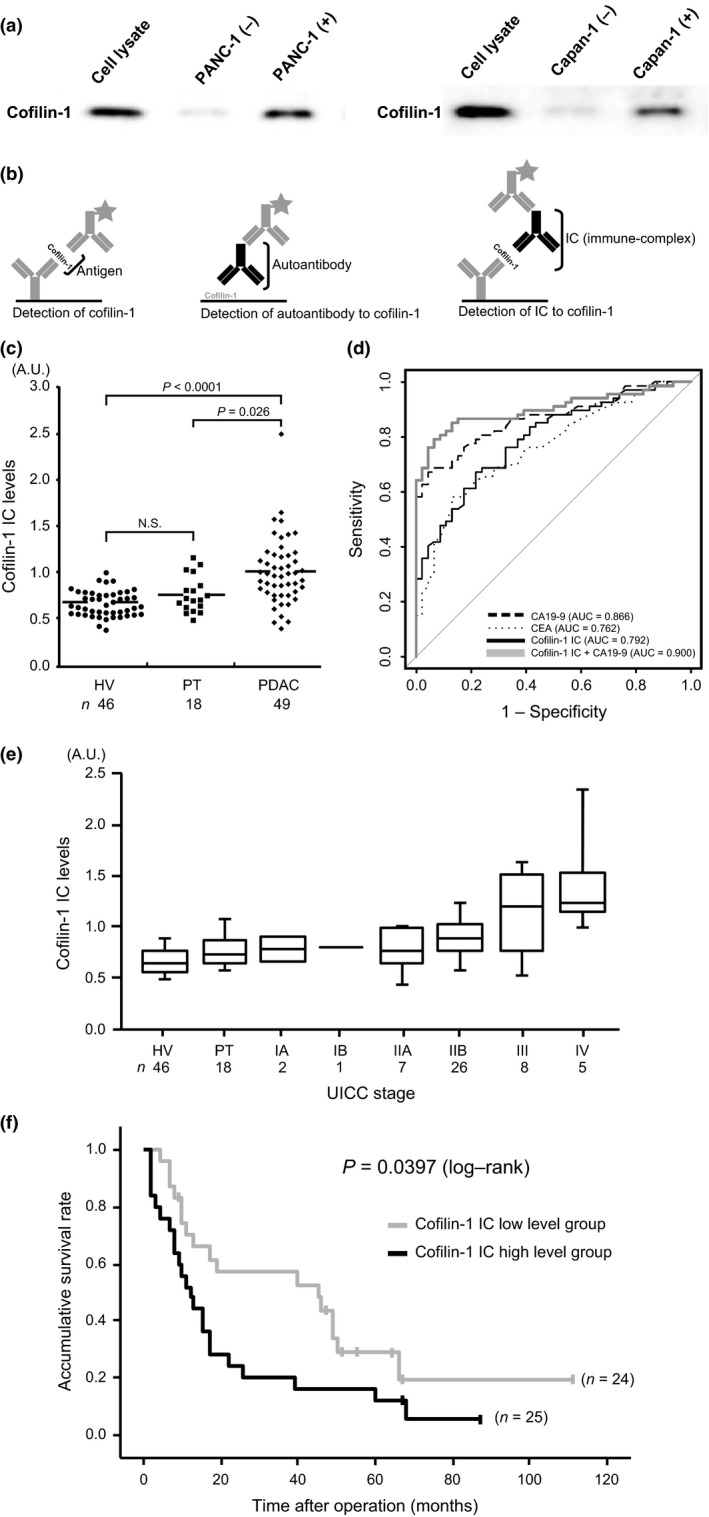
Figure 4.

Detection and clinical utility of the cofilin‐1 immune‐complex in sera of patients with pancreatic ductal adenocarcinoma (PDAC). (a) Left lane, cell lysates were applied as a loading control. Middle lane, supernatant of the medium (containing 10% FBS) in which no cells were cultured was used as a negative control. Cofilin‐1 was detected very weakly. Right lane, supernatant of the medium in which PANC‐1 and Capan‐1 cells were cultured for 24 h. Cultured supernatant was incubated in new medium for 24 h. Intense expression of cofilin‐1 was detected. (b) Schema of three detection systems of sandwich ELISA (left, cofilin‐1 antigen; middle, cofilin‐1 autoantibody; right: cofilin‐1 immune‐complex [IC]). (c) Measurement of IC to cofilin‐1 in sera of healthy volunteers (HV), patients with pancreatitis (PT), and PDAC patients. (d) Comparison of receiver operating characteristic curves for classification of cancer (PDAC) and non‐cancer (HV and PT) patients. Dashed line, cancer antigen 19‐9 (CA19‐9); dotted line, carcinoembryonic antigen (CEA); black line, cofilin‐1 IC; bold gray line, combination score of cofilin‐1 IC and CA19‐9 estimated by the logistic regression model. Thin gray line represents the random classification. (e) IC levels in HVs, PT, and each stage of PDAC (according to Union for International Cancer Control criteria). (f) Gray and black lines indicate cofilin‐1 IC low and high level groups, respectively. Kaplan–Meier survival curves show unfavorable prognosis in the cofilin‐1 IC high level group (P = 0.0397).
