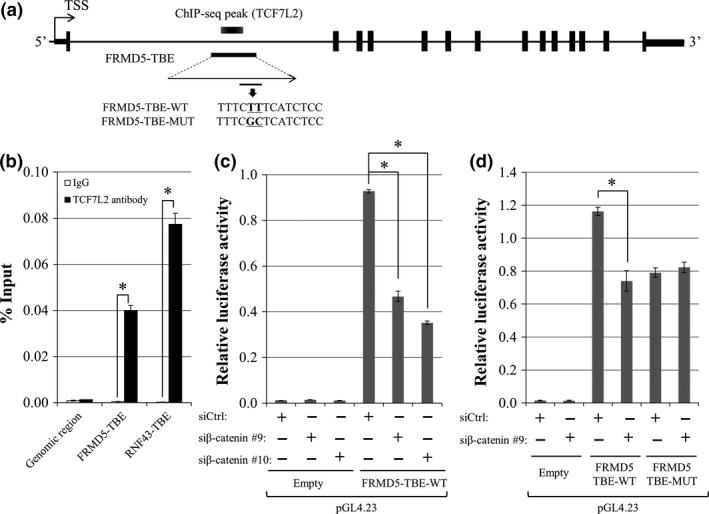
Figure 3.

Identification of an FRMD5‐interacting region and its transcriptional activity. (a) Genomic structure of FRMD5 and the candidate FRMD5‐interacting region in intron1. (b) Association of the candidate region with TCF7L2 was analyzed by ChIP‐qPCR with anti‐TCF7L2 antibody. A TCF7L2‐binding region in RNF43 was used as a positive control. Quantitative PCR was performed in triplicate (mean ± SD). (c) Transcriptional activity of the candidate region. Reporter assay was performed using reporter plasmids containing the region with/without β‐catenin siRNA in HCT116 cells. (d) Luciferase activities of the wild type and mutant reporter plasmids. Luciferase activities were measured in triplicate (mean ± SD). An asterisk indicates statistical significance (Student's t‐test or Dunnett's test, P < 0.05).
