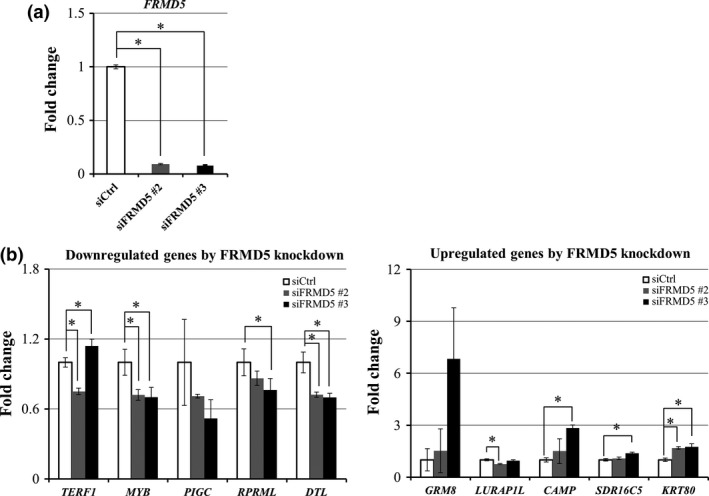
Figure 4.

Genes with altered expression by the knockdown of FRMD5. (a) Decreased expression of FRMD5 in response to FRMD5 siRNA #2 and #3. (b) Top five downregulated genes (left) and top five upregulated genes (right) by FRMD5 siRNA in HCT116. Quantitative PCR was performed in triplicate using RNA from the cells treated with FRMD5 siRNA #2 (gray) or #3 (black), or control siRNA (white). Relative expression levels of the ten genes are shown in the histogram (mean ± SD) and result was normalized by GAPDH. An asterisk indicates statistical significance (Dunnett's test, P < 0.05) between FRMD5 siRNA and control siRNA.
