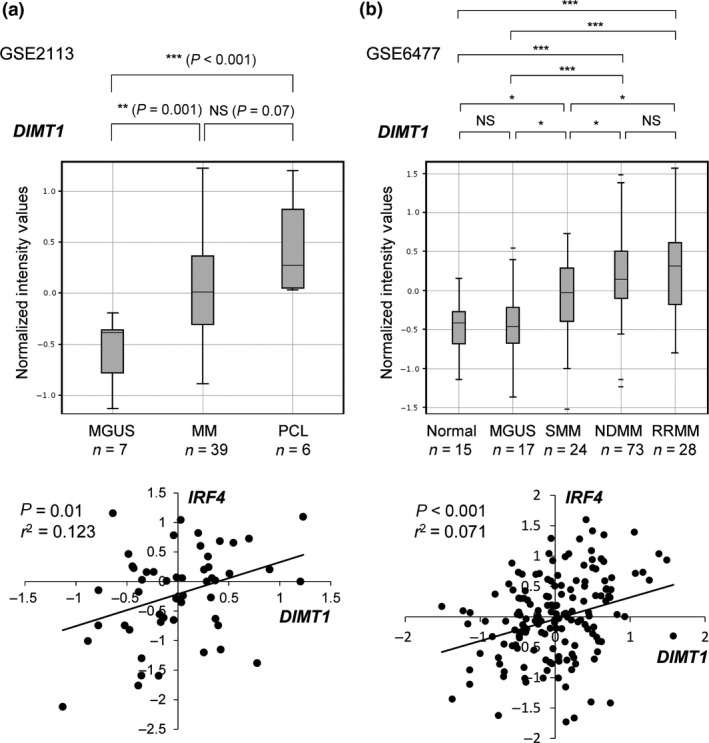
Figure 5.

Upregulation of DIMT1 during disease progression of multiple myeloma (MM) and its correlation with IRF4 expression. (a) Comparison of DIMT1 expression from published dataset GSE2113 including primary samples of monoclonal gammopathy of undetermined significance (MGUS; n = 7), MM (n = 39), and plasma cell leukemia (PCL; n = 6). Correlation of IRF4 with DIMT1 is shown in the bottom graph. (b) Comparison of DIMT1 expression from the published dataset GSE6477 including primary samples of normal plasma cells (n = 15), MGUS (n = 17), smoldering multiple myeloma (SMM; n = 24), newly diagnosed MM (NDMM; n = 73), and relapsed/refractory MM (RRMM; n = 28). Correlation of IRF4 with DIMT1 is also shown in bottom graph. All plots show the 25th–75th percentiles (boxes) and 5th–95th percentiles (whiskers). The line in each box represents the median. *P < 0.05; **P < 0.01; ***P < 0.001; NS, not significant by Student's t‐test; r 2, correlation coefficient.
