
Figure 6.
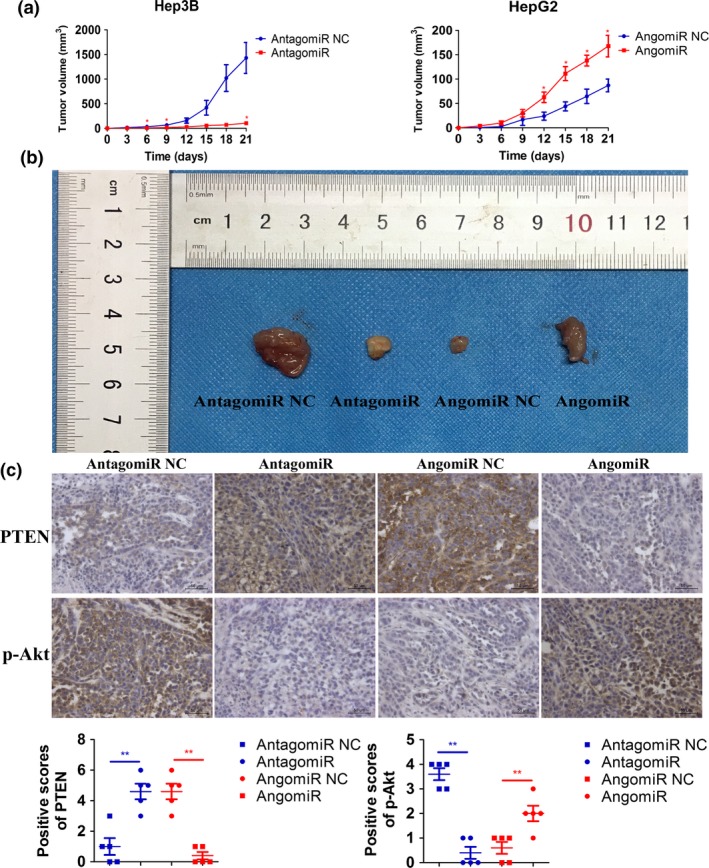
MiR‐155‐5p promotes HCC progression in vivo. (a) Growth curves of Hep3B and HepG2 cell line xenograft tumors after injection with miR‐155‐5p antagomiR and miR‐155‐5p angomiR, respectively. Tumor volumes are showed as mean SD for each goup of six mice. (b) BALB/c nude mice resected tumors from each group are shown. (c) The top panel shows representative pictures of PTEN and p‐Akt expression in the tissues resected from mice injected Hep3B with antagomiR or antagomiR NC, or HepG2 with angomiR or angomiR NC. The bottom panel shows positive scores of PTEN and p‐Akt expression in the implanted tumors resected from mice injected Hep3B with antagomiR or antagomiR NC, or HepG2 angomiR or angomiR NC. *P < 0.05, **P < 0.01, versus antagomiR NC and angomiR NC, respectively, by Student's t‐test.