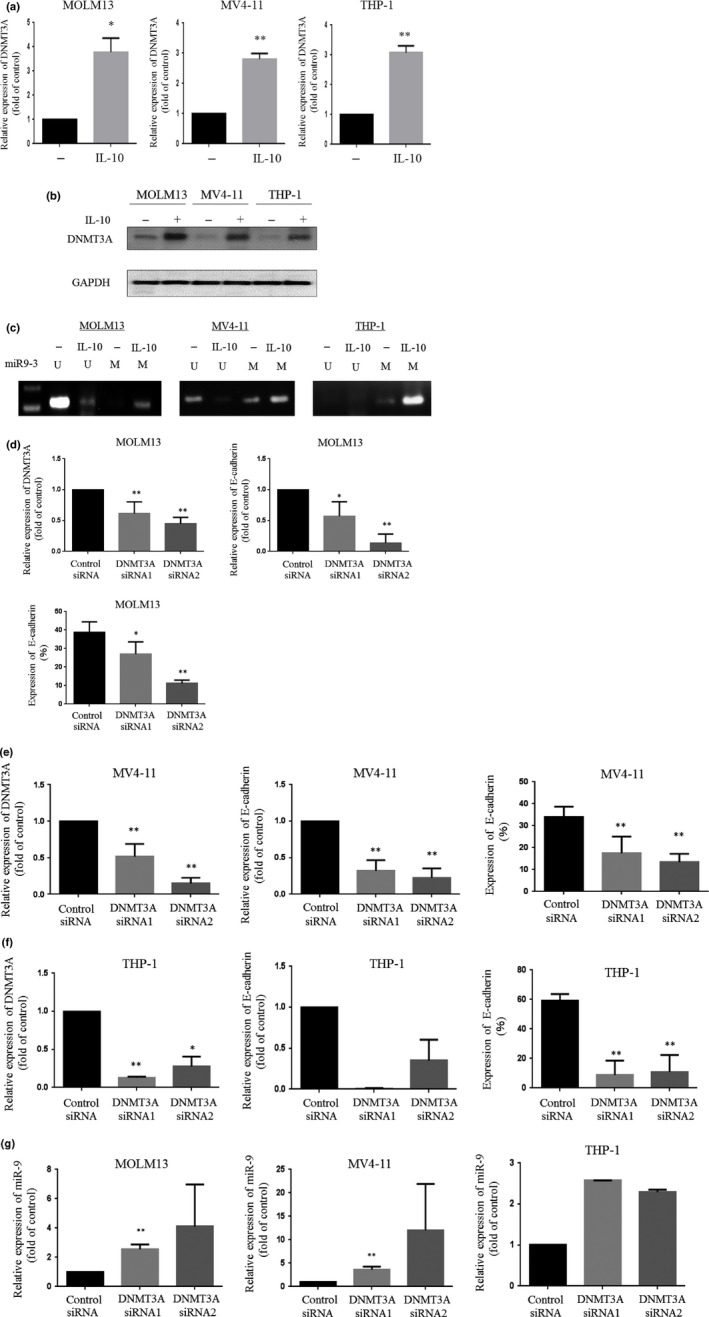
Figure 3.

Effect of interleukin‐10 (IL‐10) on DNA methyltransferase 3A (DNMT3A) expression in leukemia cells. (a) DNMT3A expression in leukemia cells treated with IL‐10 was analyzed by real‐time RT‐PCR. (b) Western blot analysis. Leukemia cells treated with IL‐10 were harvested, and subjected to Western blot analysis to monitor the levels of the indicated proteins. (c) Methylation‐specific PCR. Leukemia cells were treated with IL‐10, and DNA was extracted from the cells. DNA with methylated CpG was processed using a MethylEasy Xceed Rapid DNA Bisulphite Modification Kit. The recovered DNA was amplified by PCR on miR‐9‐3 CpG islands. The experiments were repeated three times. M, methylation of the gene promoter; U, unmethylated gene promoter. (d–f) DNMT3A expression in MOLM13 (d), MV4‐11 (e), and THP‐1 (f) cells transfected with either control siRNA or DNMT3A siRNAs was analyzed by real‐time RT‐PCR. E‐cadherin expression in leukemia cells transfected with either control or DNMT3A siRNAs was analyzed by real‐time RT‐PCR and flow cytometry. (g) Expression of miR‐9 in leukemia cells transfected with either control or DNMT3A siRNAs was analyzed using an Mir‐X miRNA qRT‐PCR SYBR Kit to measure the levels of the indicated gene. The results shown represent the mean ± SD of three experiments carried out in triplicate. *P < 0.05; **P < 0.01.
