Figure 1.

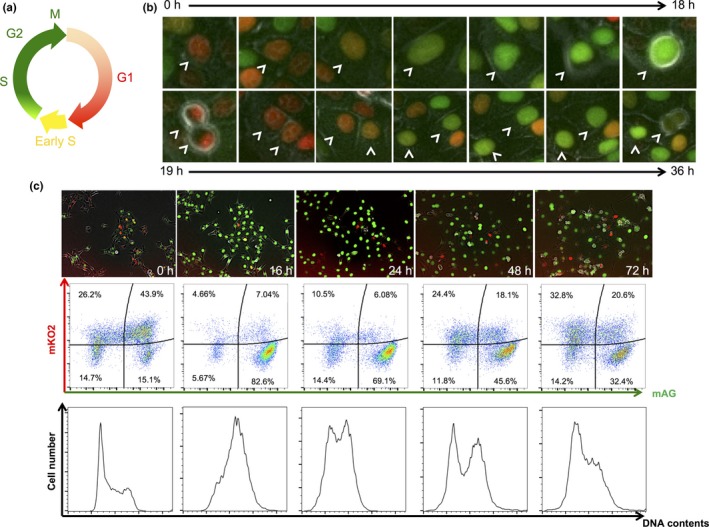
Functional examination of SAS‐Fucci cells. (a) Schematic diagram of fluorescence colors emitted by the Fucci system during the cell cycle. (b) Time‐lapse imaging of Fucci fluorescence during cell cycle progression. Arrowheads indicate the same SAS‐Fucci cell nucleus. (c) Time course of cell population during cell cycle progression following 10 Gy irradiation. Upper panels, time‐lapse imaging of Fucci fluorescence. Middle panels, time course of 2‐D flow cytometric analysis of fluorescence intensities of monomeric Azami Green (mAG; green) and monomeric Kusabira Orange 2 (mKO2; red). Proportions of cells in each cell fraction are shown as percentages. Lower panels, time course of DNA content analysis.
