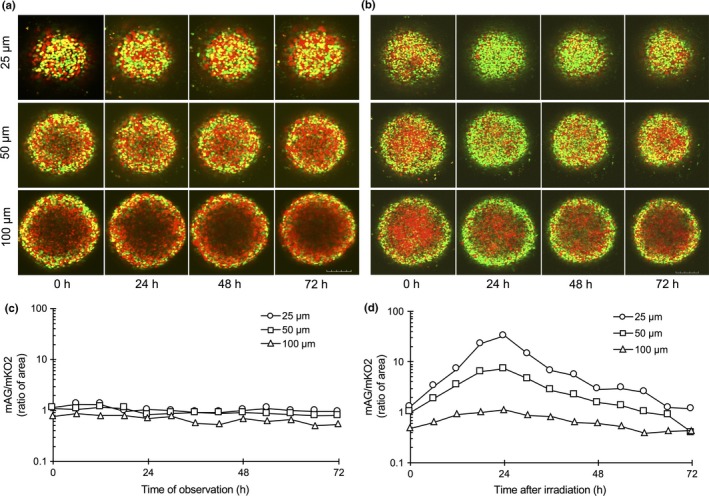
Figure 3.

Time‐lapse imaging inside of spheroids in live conditions. Time‐lapse imaging of Fucci fluorescence at various depths from the bottom of the spheroid in the absence (a) or presence (b) of irradiation. Fucci fluorescence inside the spheroid for up to 72 h after sham or 10 Gy irradiation was determined at each depth using a confocal laser scanning microscope. Bar = 200 μm. Time course of ratio of monomeric Azami Green (mAG; green) to monomeric Kusabira Orange 2 (mKO2; red) area at each depth in the absence (c) or presence (d) of irradiation. Areas of red or green fluorescence at each depth were quantitated using ImageJ 1.44 software. Ratios were plotted as a function of time after start of the observation or irradiation. Representative values are shown.
