Figure 4.

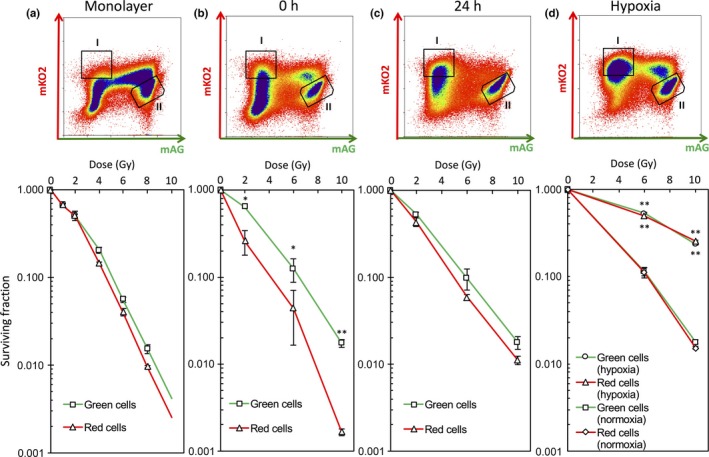
Isolation of outer and inner cells grown in spheroids and determination of their radiosensitivities. (a) Upper panel, FACS fractions of cells grown in monolayers sorted by flow cytometry: I, red cells; II, green cells. Lower panel, dose–survival curves for sorted red and green cells immediately after indicated doses of irradiation. Data represent mean ± SE of three independent determinants. (b) Upper panel, FACS fractions of cells grown in spheroids sorted by flow cytometry immediately after 10 Gy irradiation: I, red cells; II, green cells. Lower panel, dose–survival curves for red and green cells from spheroids obtained immediately after indicated doses of irradiation. Data represent mean ± SE of three independent experiments. *P < 0.05; **P < 0.01. (c) Upper panel, FACS fractions of cells grown in spheroids sorted by flow cytometry 24 h after 10 Gy irradiation: I, red cells; II, green cells. Lower panel, dose–survival curves for red and green cells 24 h after indicated doses of irradiation. Data represent mean ± SE of three independent experiments. Some error bars cannot be seen because they would be smaller than the symbols. (d) Upper panel, FACS fractions of cells grown in spheroids sorted by flow cytometry 24 h after 10 Gy of irradiation under severe hypoxia: I, red cells; II, green cells. Spheroids were subjected to severe hypoxia for 9 h and then irradiated at the indicated doses. After irradiation, spheroids were returned to normoxia and incubated for 24 h. The spheroids were then disaggregated and red and green cells were sorted by flow cytometry. Lower panel, dose–survival curves for red and green cells 24 h after indicated doses of irradiation under severe hypoxia. Data represent mean ± SE of triplicate determinants. Some error bars cannot be seen because they would be smaller than the symbols. **P < 0.01.
