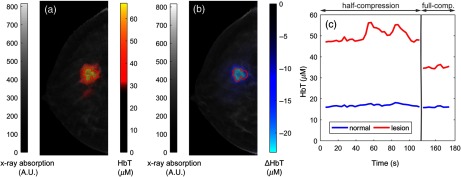
Fig. 8.
(a) Absolute HbT concentration map of the slice corresponding to the tumor centroid, overlaid over the corresponding x-ray DBT slice. (b) Change in HbT concentration as the compression is increased from half to full mammographic force. The red line in (a) and (b) denotes the tumor outline as marked by our collaborating radiologist. (c) The time course of HbT concentration in the tumor region and normal breast tissue, respectively, during the entire measurement session (the vertical bar and break in the timeline indicate where compression was increased from half to full mammographic compression).

