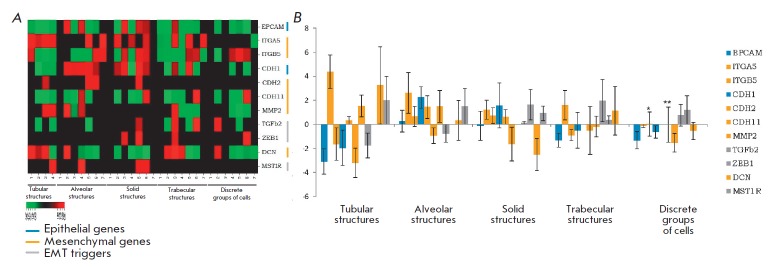
Fig. 6.
Expression of EMT genes in different morphological structures of breast tumors. A – a heat map of the expression level. B – the mean log expression level. * – an expression level of 0.029. ** – an expression level of 0.016. The large standard error of the mean is due to the small sample size, significant variation in expression levels among patients, and the absence of gene expression in some samples of the morphological structure

