Figure 3.

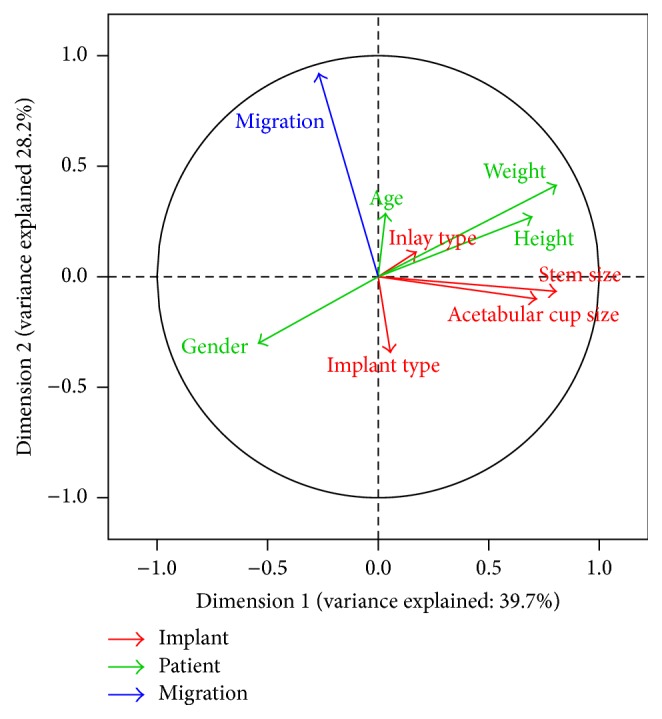
Correlation circle of the first two dimensions. Variables attributed to the patient are shown in green, variables of implants are shown in red, and migration is shown in blue.

Correlation circle of the first two dimensions. Variables attributed to the patient are shown in green, variables of implants are shown in red, and migration is shown in blue.