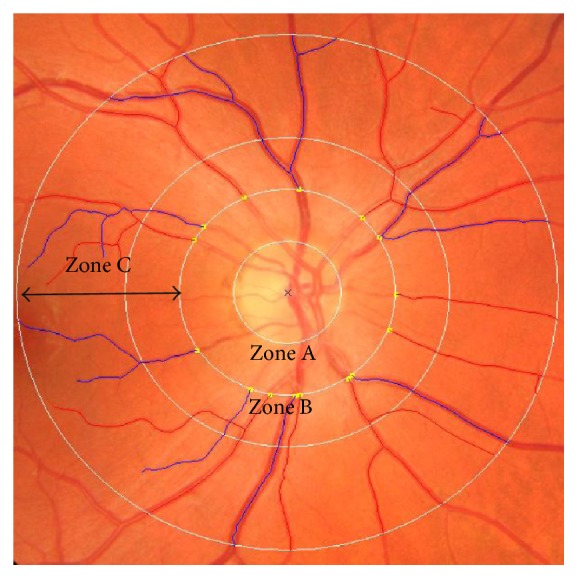
Figure 2.

Retinal image processed by SIVA and used for analysis of vascular caliber, fractal dimension, tortuosity, length-diameter ratio, and branching coefficients. Marked are zone A, zone B, and zone C, located 0–0.5, 0.5–1.0, and 0.5–2.0 disc diameters from the center of the disc. In zones B and C, retinal arterioles have been marked in red and venules in blue.
