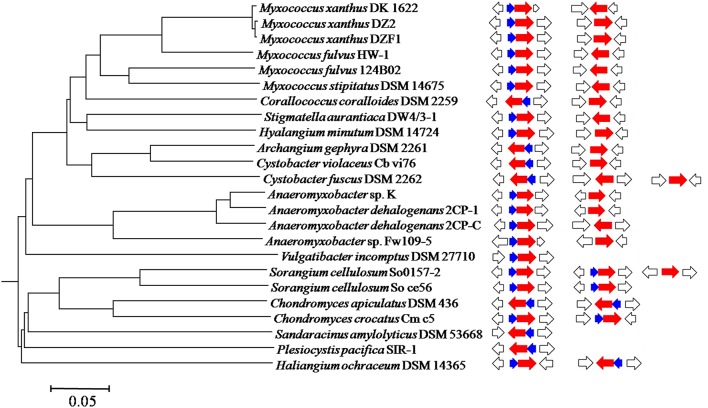
Figure 1.
A phylogenomic tree constructed using 24 sequenced myxobacterial genomes. The bar equals to 0.05 of the phylogenetic distance. The occurrences of groEL and groES genes in each genome were correspondingly integrated into the tree. Blue, red, and white arrows indicate groES, groEL and flanking genes, respectively.

