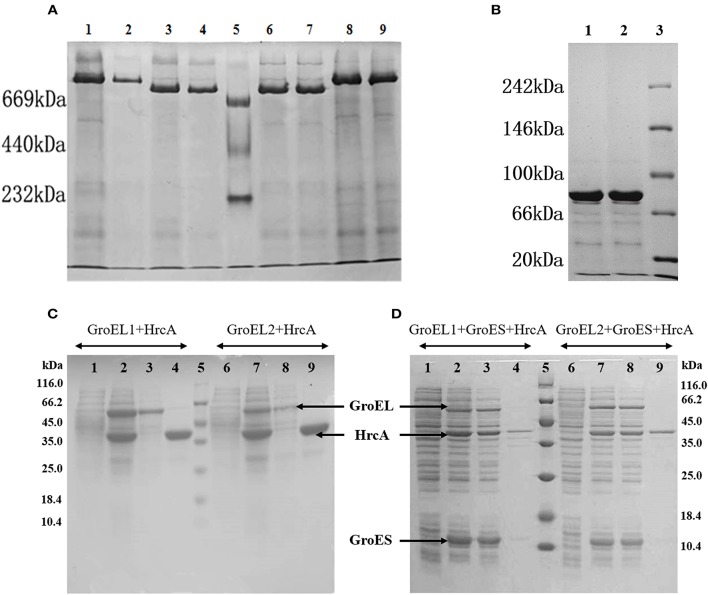
Figure 4.
In vivo forms and refolding activities of GroELs and GroES proteins from M. xanthus DK1622 in E. coli cells. (A,B) Native-PAGE analysis of extracts from E. coli cells expressing various arrays of DK1622 groEL and groES genes. (A) Lanes 1–2, co-expression of GroEL1 and GroES; lanes 3–4, expression of GroEL1 alone; lane 5, native protein markers; lanes 6–7, expression of GroEL2 alone; lanes 8–9, co-expression of GroEL2 and GroES. (B) Lanes 1–2, expression of GroES alone; lane 3, native protein markers. Each sample was repeated twice in gel for reliability of the Native-PAGE results. (C,D) SDS-PAGE analysis of co-expression of hrcA with groEL1 (left) or groEL2 (right) in the absence and presence of groES in E. coli cells, respectively. Lane 1, 6, before induction with IPTG; lane 2, 7, after induction; lane 3, 8, supernatants; lane 4, 9, sediments; lane 5, Mw markers. Ten microlitres were loaded for each lane.

