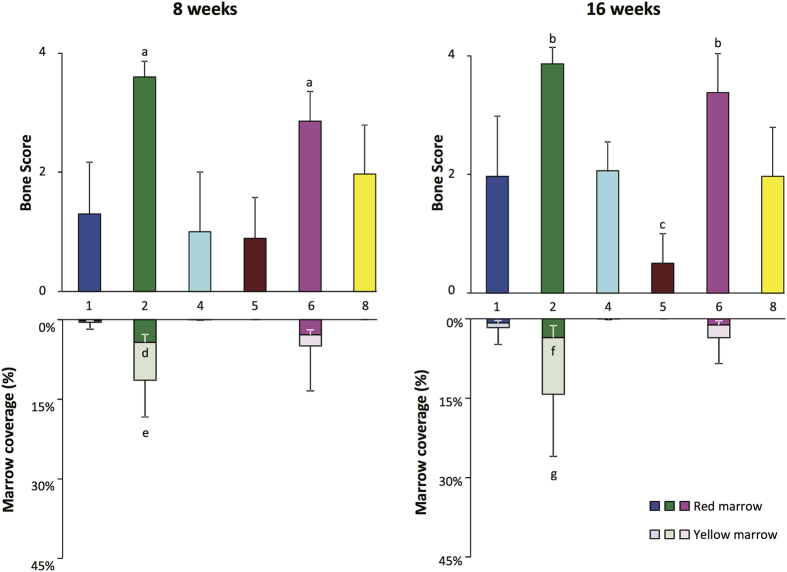
Figure 5. Bone formation, support of hematopoiesis and adipose tissue formation for BMSC lots from each of the 6 centers tested using the ectopic bone transplantation model in immunocompromised mice.
The bone formation scores are shown in the upper portion of each panel and the area of marrow coverage by hematopoietic progenitor cells (red marrow) and adipose tissue (yellow marrow) are shown in the lower portion of each panel. The results of analysis 8 weeks after transplantation are shown in the left panel and 16 weeks after transplantation in the right panel. The values shown represent the mean ± SD. “a” is p < 0.01 vs. Centers #1, #4, #5 and #8; “b” is p < 0.01 vs. Centers #1, #4, #5 and #8; “c” is p < 0.05 vs. Centers #1, #4 and #8; “d” is p < 0.05 vs. Center #6; “e” is p < 0.01 vs. Center #1 and p < 0.05 vs. Centers #4 and #5; “f” is p = 0.062 vs. Center #1; “g” is p < 0.01 vs. Center #4, #5 and #8; and p < 0.05 vs. Center #1.

