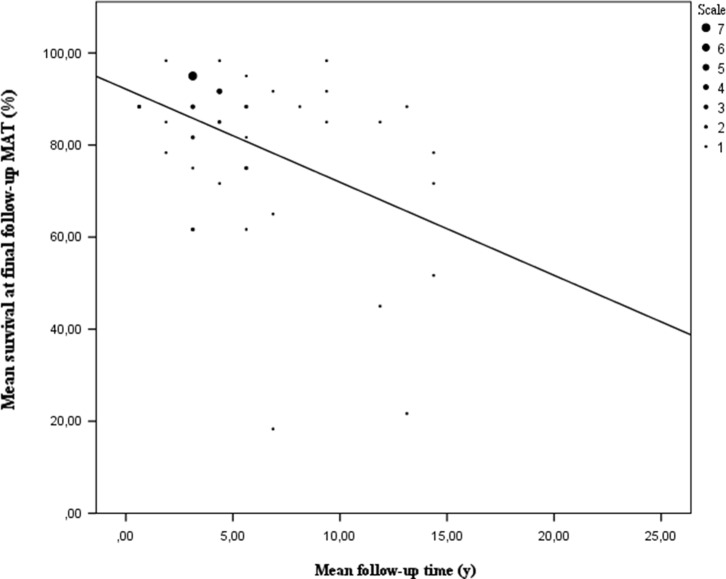
Figure 8.
Mean survival at final follow-up by mean follow-up time. It is clearly depicted that the mean survival rate of the allograft linearly declines with follow-up time. As depicted at a mean follow-up time of 10–15 years almost half of the allografts tend to fail. The heterogeneous spreading of data at this mean follow-up time can be ascribed to the heterogenity of failure criteria used. The same can be stated for the outlier at a mean follow-up of seven years. Figure 7 also depicts tthat most of the data collected lies between a mean follow-up of 2–10 years.

