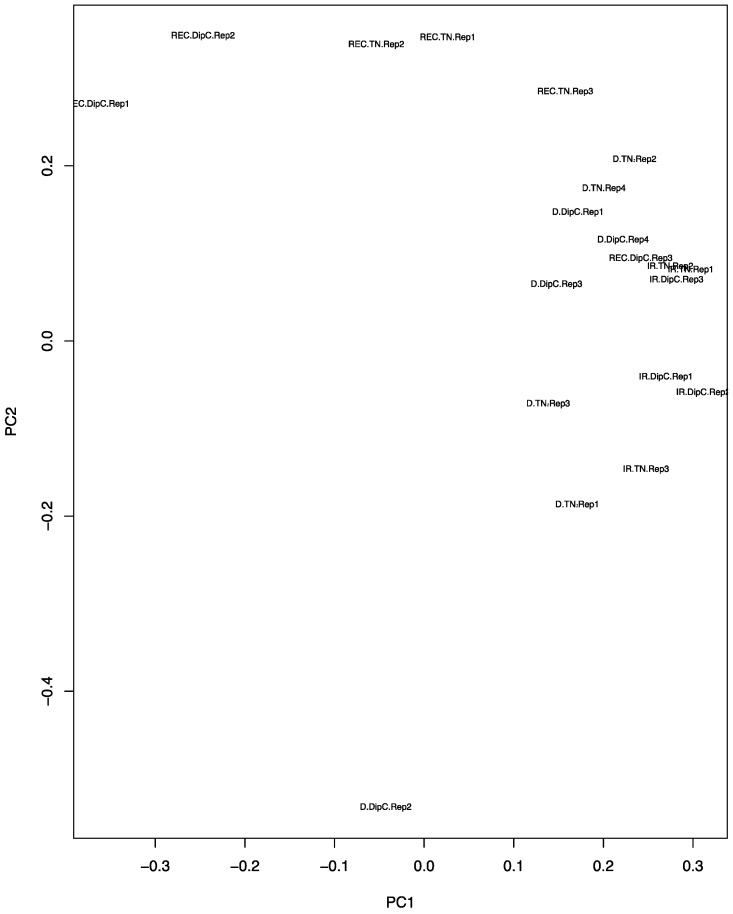
Figure 2.
Principal component analysis (PCA) plot of the expression data from the microarrays. The principal components PC1 and PC2 values for each chip have been placed on a scatter plot. Each chip result is defined by a three-part character string consisting of the treatment, genotype, and replicate number. IR, D, and REC refer to water-sufficient, water-limited, and recovery treatment, respectively; the genotypes are DipC and TN; and Rep1–4 refers to the specific biological replicate. Note, the water-sufficient and recovery treatments have only three replicates, while dehydration has four.

